Explore the landscape
of VIS4QC.

Browse studies and tools in visualization for quantum computing, organized by purpose, subject, and visualization approach.

50 research entries 19 industry toolsRead the Paper
A MAP OF THE FIELD

What would you like to explore?

Qubits & StatesGates & CircuitsMachines & SystemsAlgorithm Development

Choose a cell to explore the matching entries.

EXPLORE THE COLLECTION

Find your perspective

69 of 69 entries

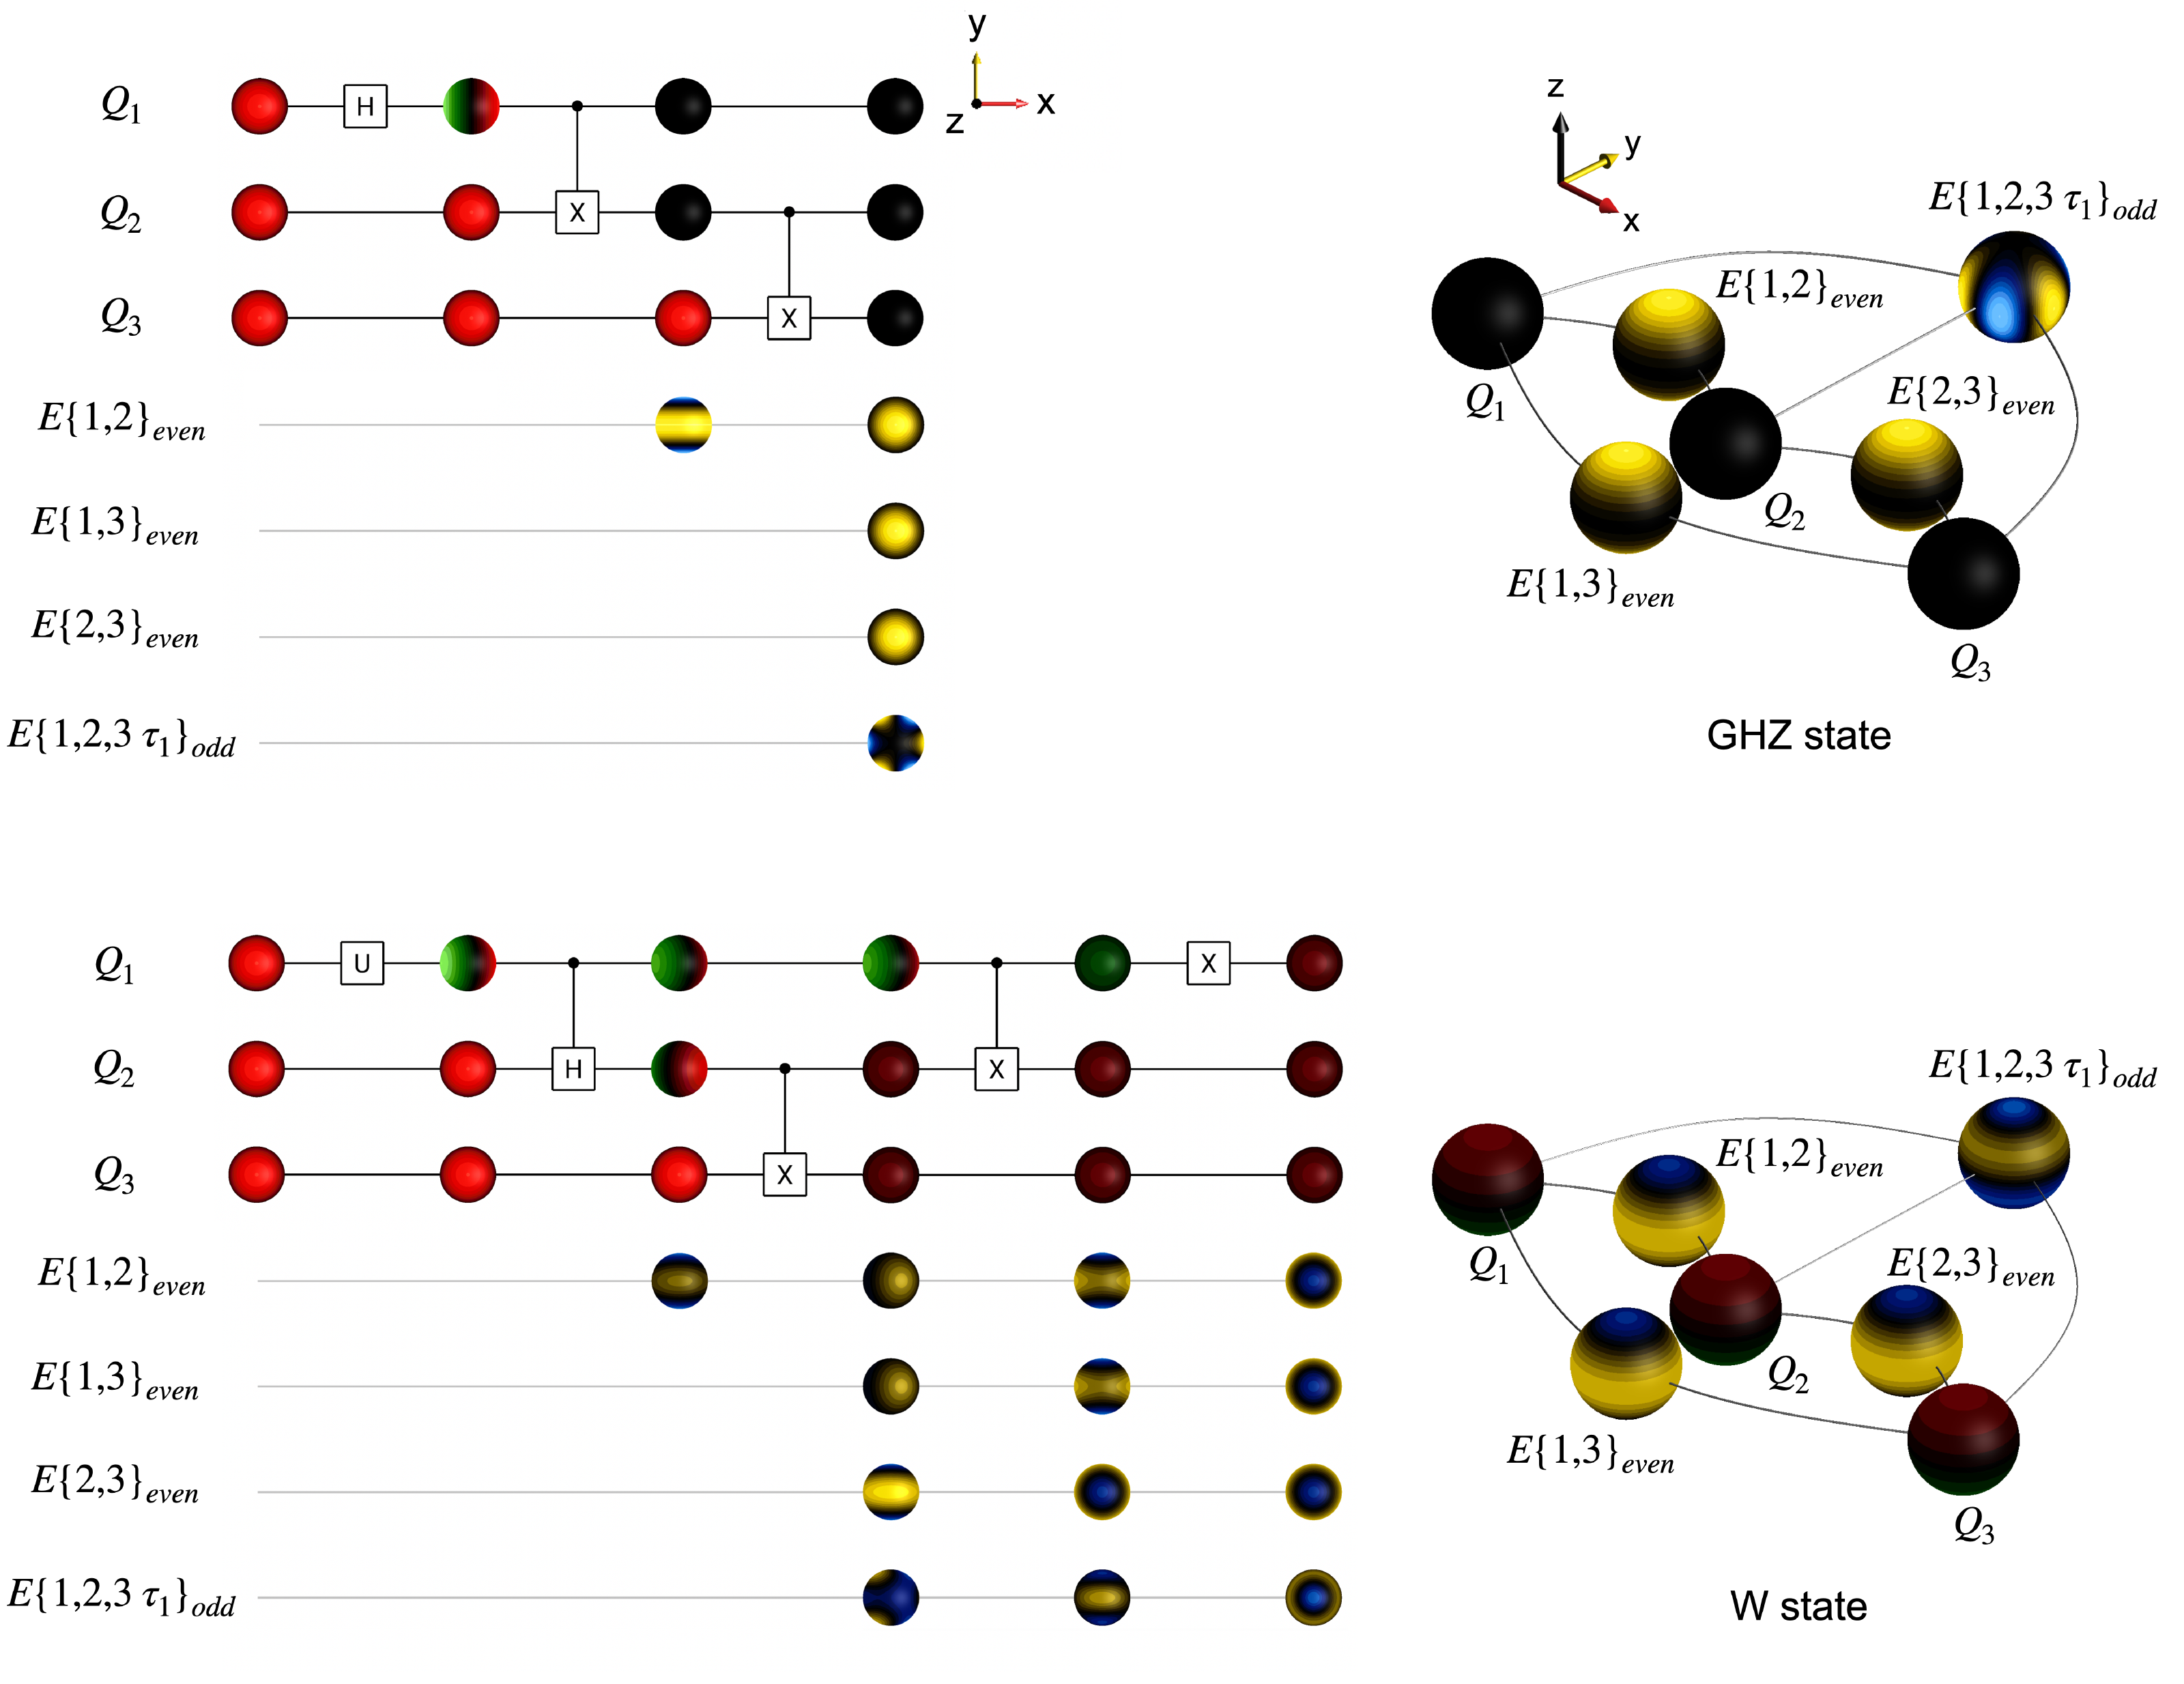
Complete GHZ and W examples, each pairing a preparation circuit and successive beads with the final arrangement of single-qubit and correlation beads.
RESEARCH2025

BEADS

D Huber, S J Glaser

Uses colored spheres to represent individual qubit states and correlations, with circuit overlays showing how gates transform these quantities.

Usage & Purpose

Learning & Interpretation

QC Subjects

Qubits & StatesGates & Circuits
Visualization labels
RESEARCH2025

But what is quantum computing? (Grover's Algorithm)

Grant Sanderson

Explains Grover's search algorithm through state vectors and their geometric relationships, using a rotation view to illustrate the algorithm's mechanism.

Usage & Purpose

Learning & Interpretation

QC Subjects

Qubits & StatesAlgorithm Development
Visualization labels
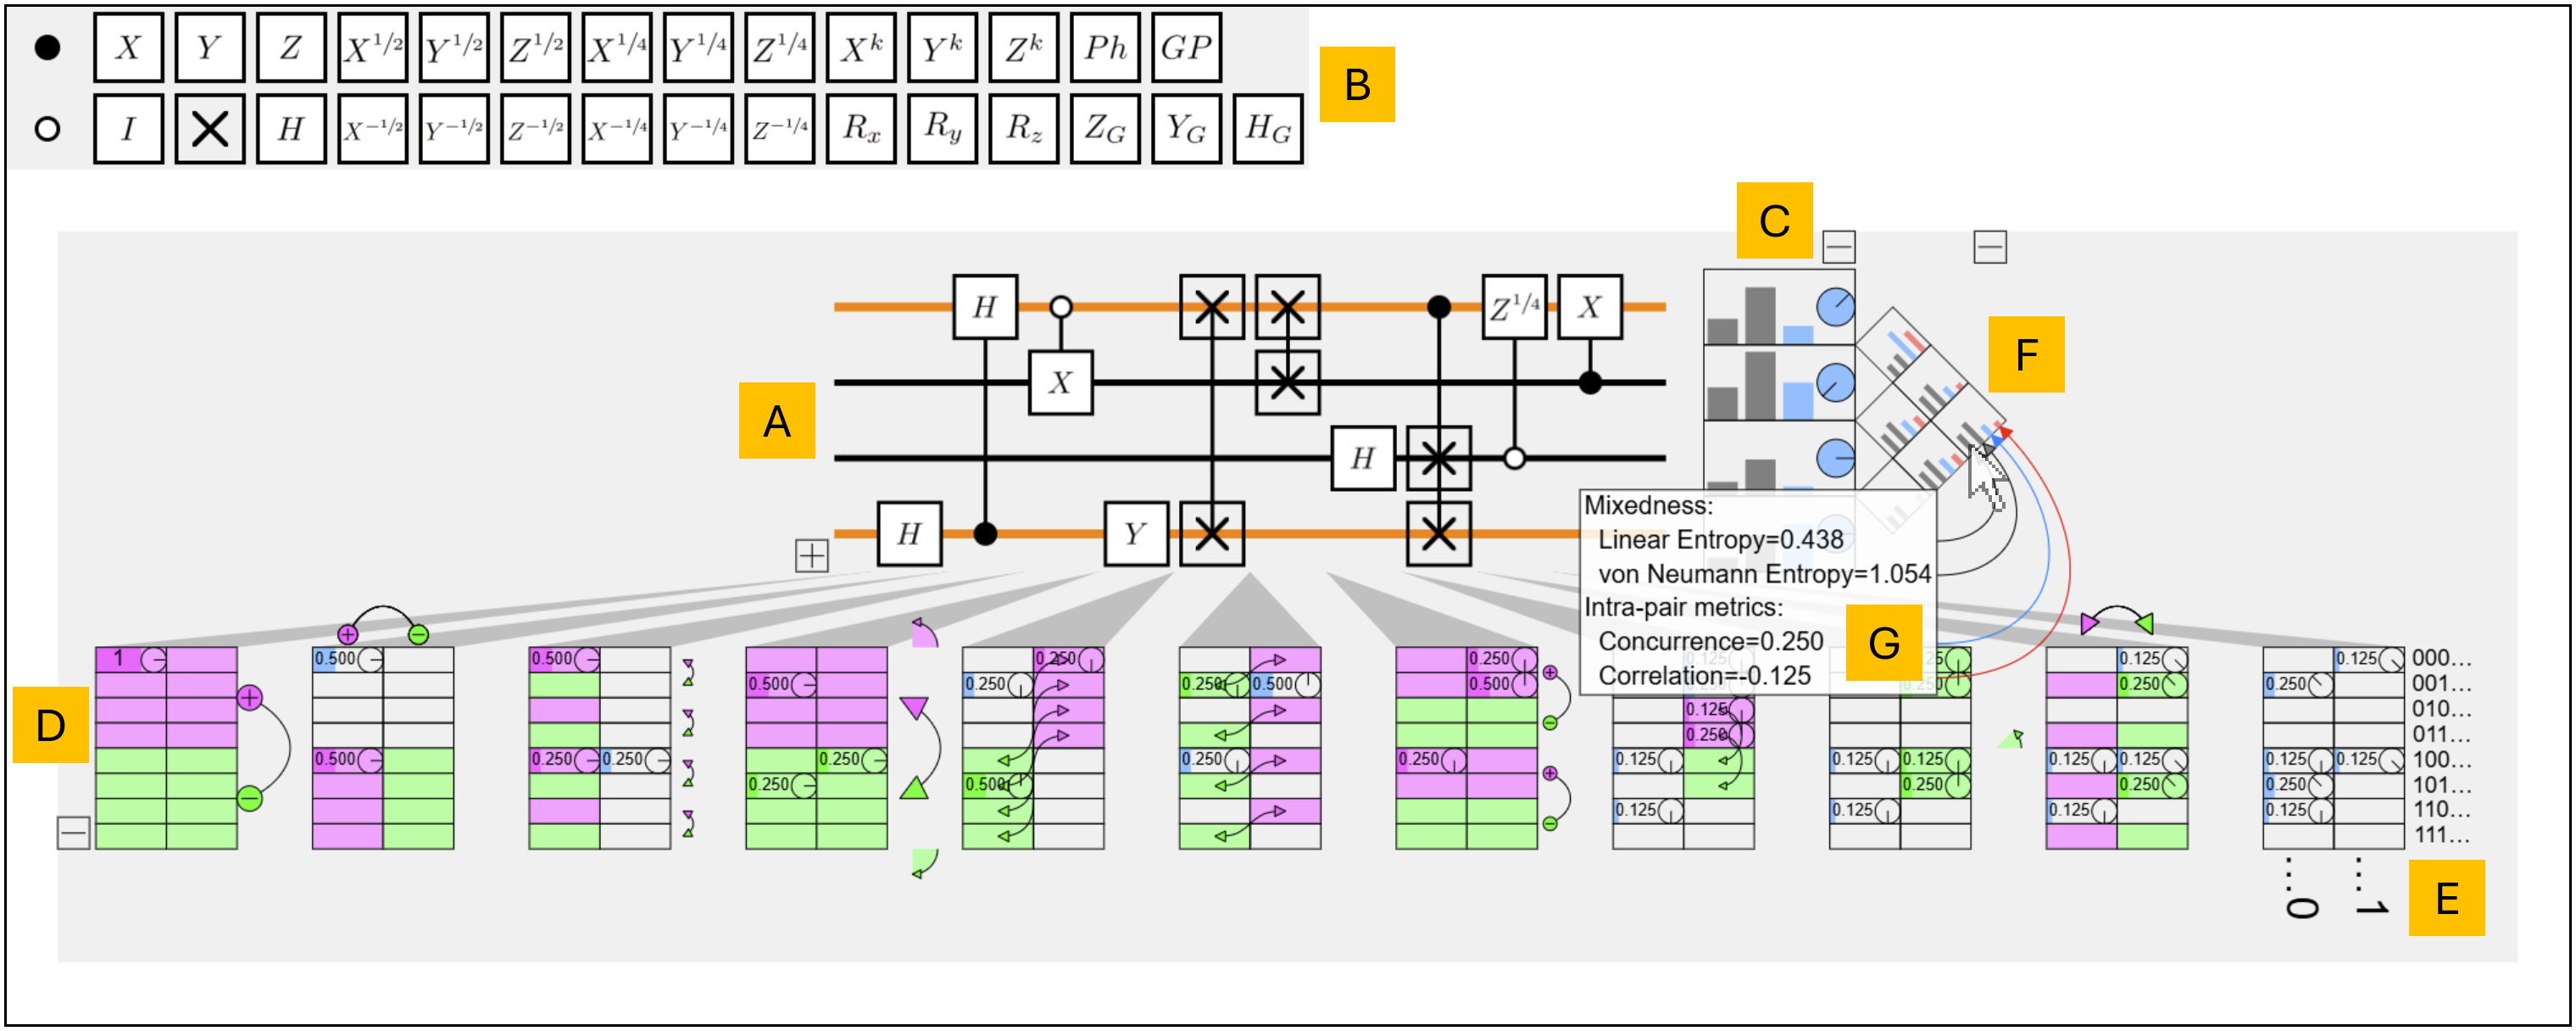
MuqcsCraft overview labeled A through G, with a circuit, gate palette, colored state vectors, reduced-state bars, and a pairwise-metric tooltip.
RESEARCH2025

MuqcsCraft

Michael J. McGuffin, Jean-Marc Robert

Highlights gate-specific amplitude changes between circuit layers and displays pairwise qubit correlations and entanglement in a triangular matrix.

Usage & Purpose

Learning & Interpretation

QC Subjects

Qubits & StatesGates & Circuits
Visualization labels
RESEARCH2025

QCanvas

Szabolcs Jóczik, Bence Kecskés, Ádám Kovács, Orsolya Kálmán, Zoltán Zimborás

Combines drag-and-drop circuit design, explanatory annotations, generated code, and simulation plots in a browser canvas for several quantum computing models.

Usage & Purpose

Learning & InterpretationProductivity & Utility

QC Subjects

Qubits & StatesGates & Circuits
Visualization labels
RESEARCH2025

Simulation and Visualization of Quantum Algorithms in Wolfram Mathematica: An Interactive Toolkit for Quantum Computing Education

Hrishitva Patel

Presents Mathematica notebook examples with adjustable Bloch-sphere angles and illustrative probability plots for discussing qubit states and quantum algorithm concepts.

Usage & Purpose

Learning & Interpretation

QC Subjects

Qubits & StatesAlgorithm Development
Visualization labels
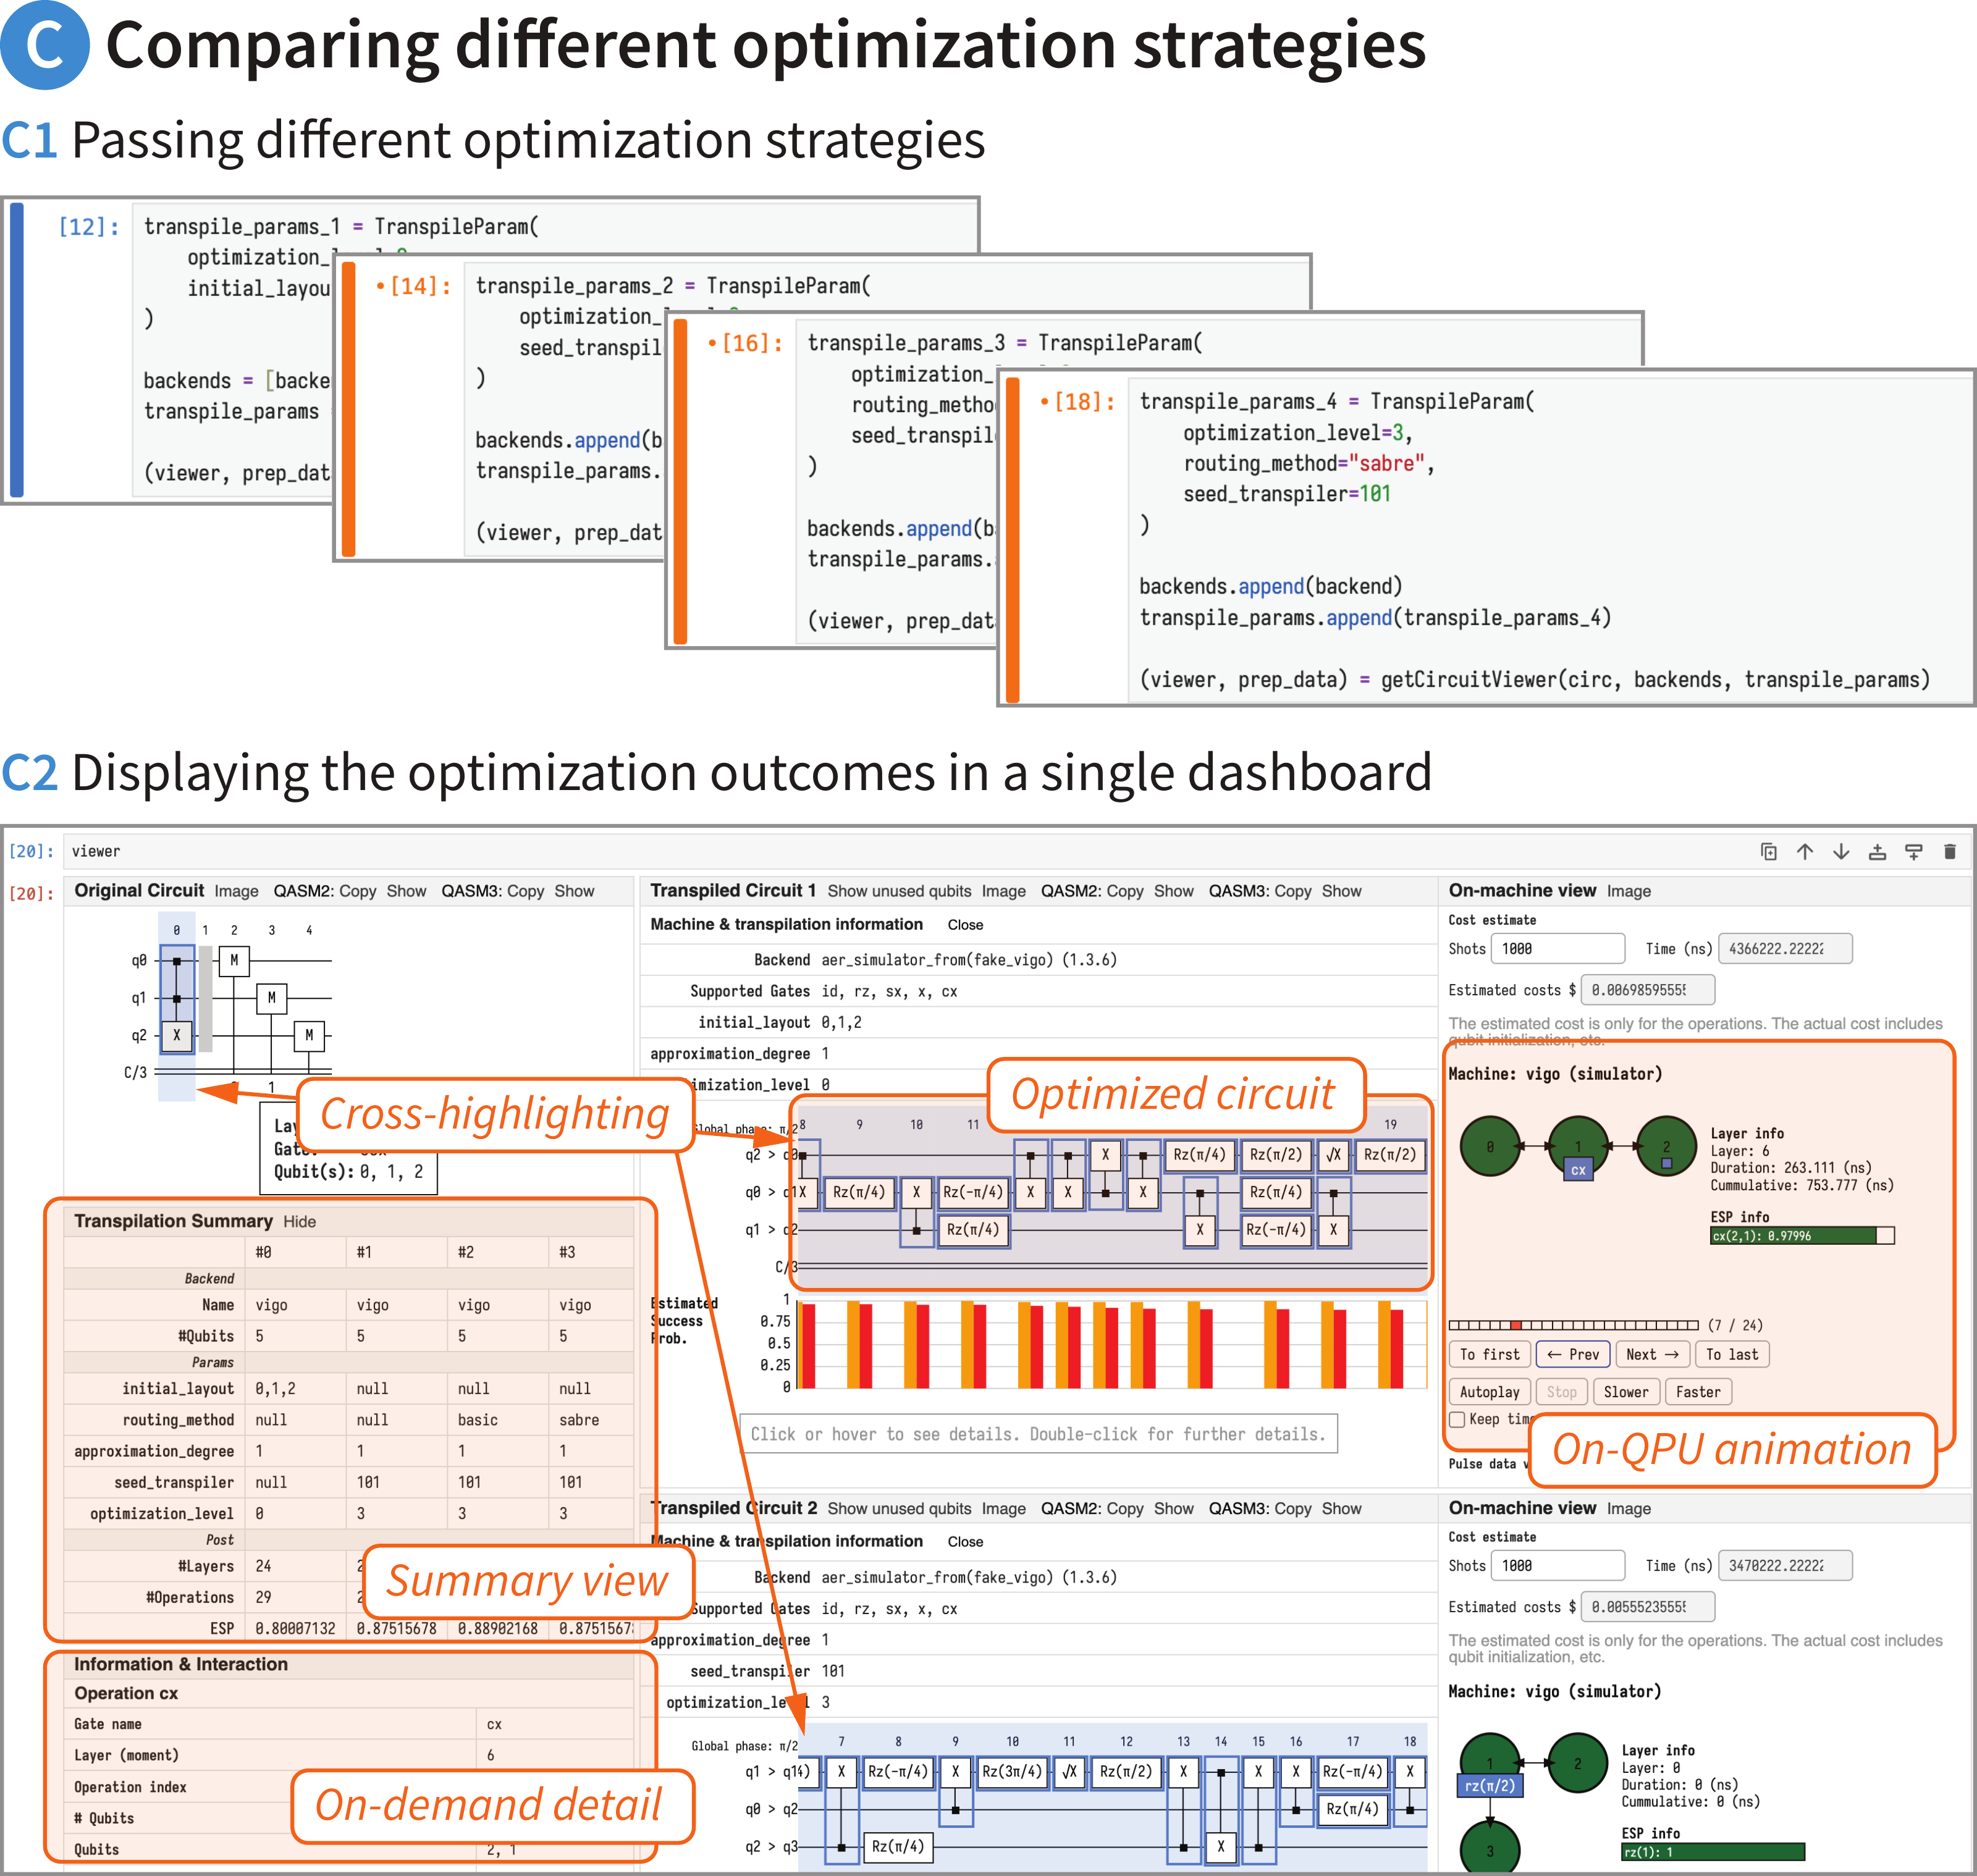
Complete code-and-dashboard example with optimization settings, original and transpiled circuits, estimated success probabilities, and a simulated-machine view.
RESEARCH2025

Toward Human-Quantum Computer Interaction: Interface Techniques for Usable Quantum Computing

Hyeok Kim, Mingyoung J. Jeng, Kaitlin N. Smith

Links problem-level inputs, circuit diagrams, hardware information, and result charts in notebook interfaces for circuit authoring, optimization comparison, and interpretation.

Usage & Purpose

Productivity & Utility

QC Subjects

Qubits & StatesGates & CircuitsMachines & Systems
Visualization labels
TOOL2025

Triple Alpha

Horizon Quantum

Triple Alpha is Horizon Quantum's environment for developing, compiling, and deploying programs across quantum processors and simulators. Its public product material presents a hardware-mapping view of processor topology, relating a quantum program's placement to the connectivity constraints of a selected device. The product also provides backend selection and describes resource analysis for programs and subroutines. Access is offered through a staged early-access program. Public visualization documentation remains limited to product material; an open visualization API or detailed visualization manual is not available among the linked resources. The hardware-mapping example provides the clearest public entry point to its visual support for device-aware development.

Usage & Purpose

Productivity & Utility

QC Subjects

Machines & Systems
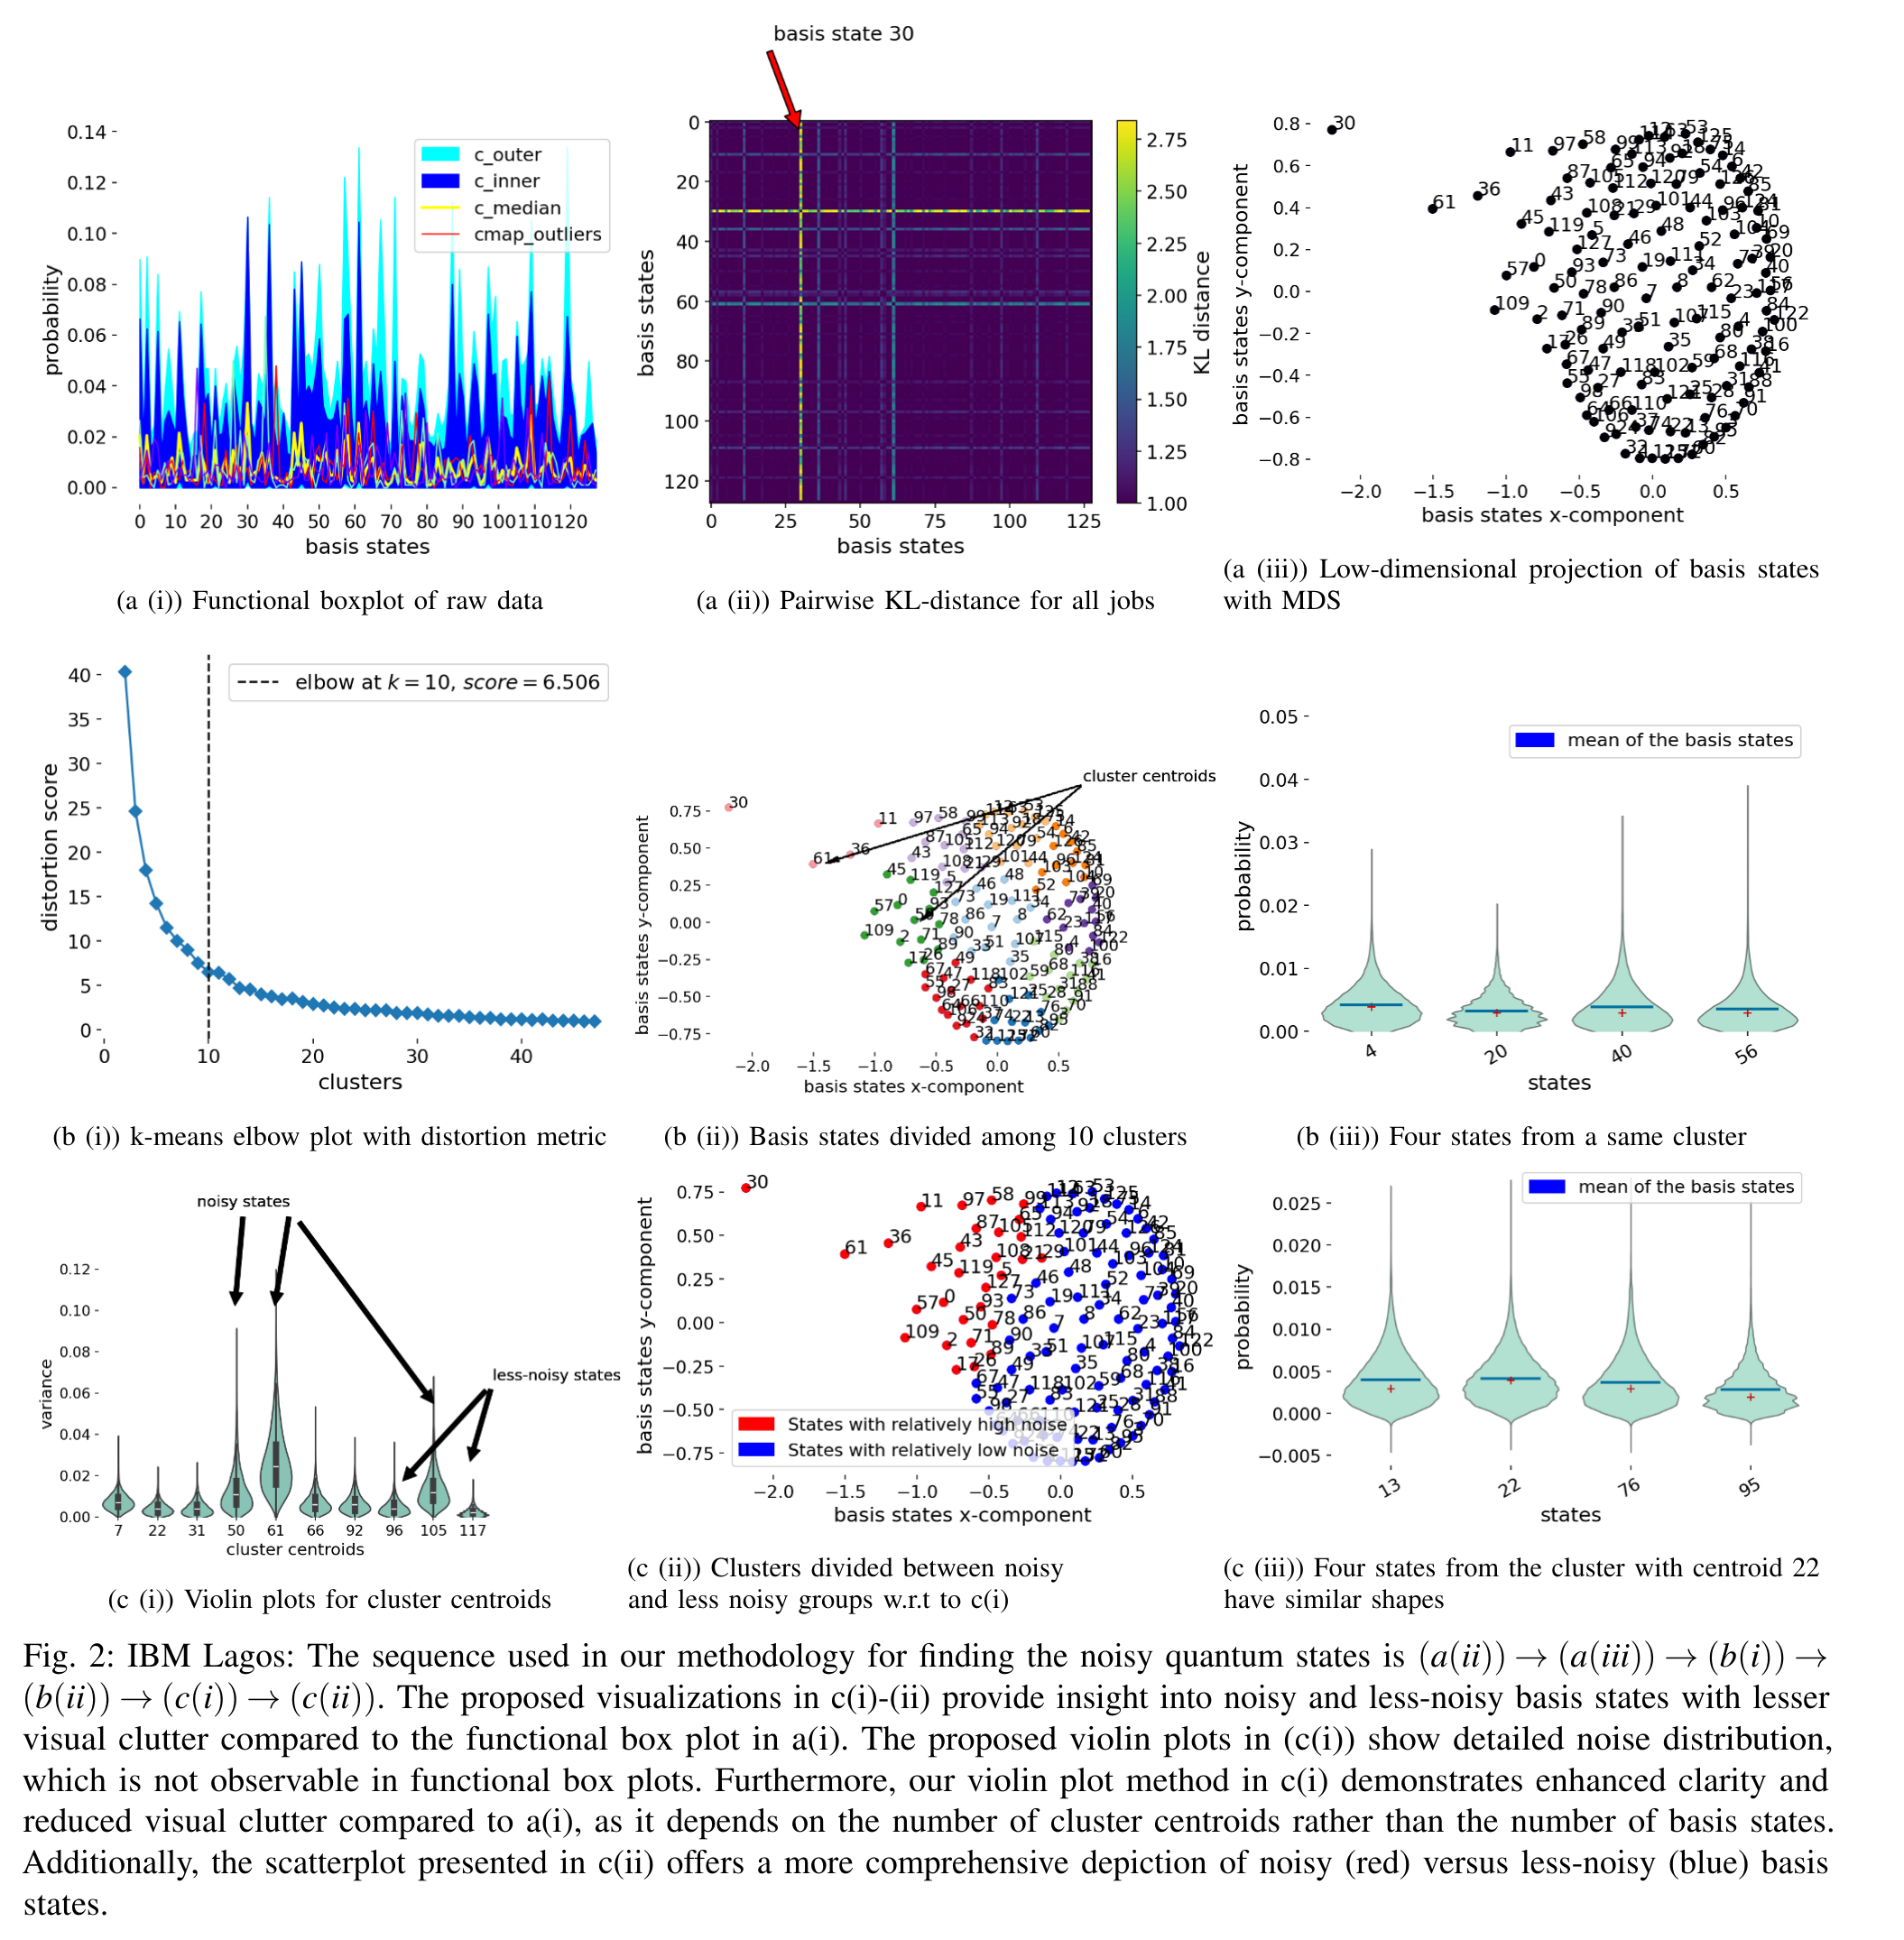
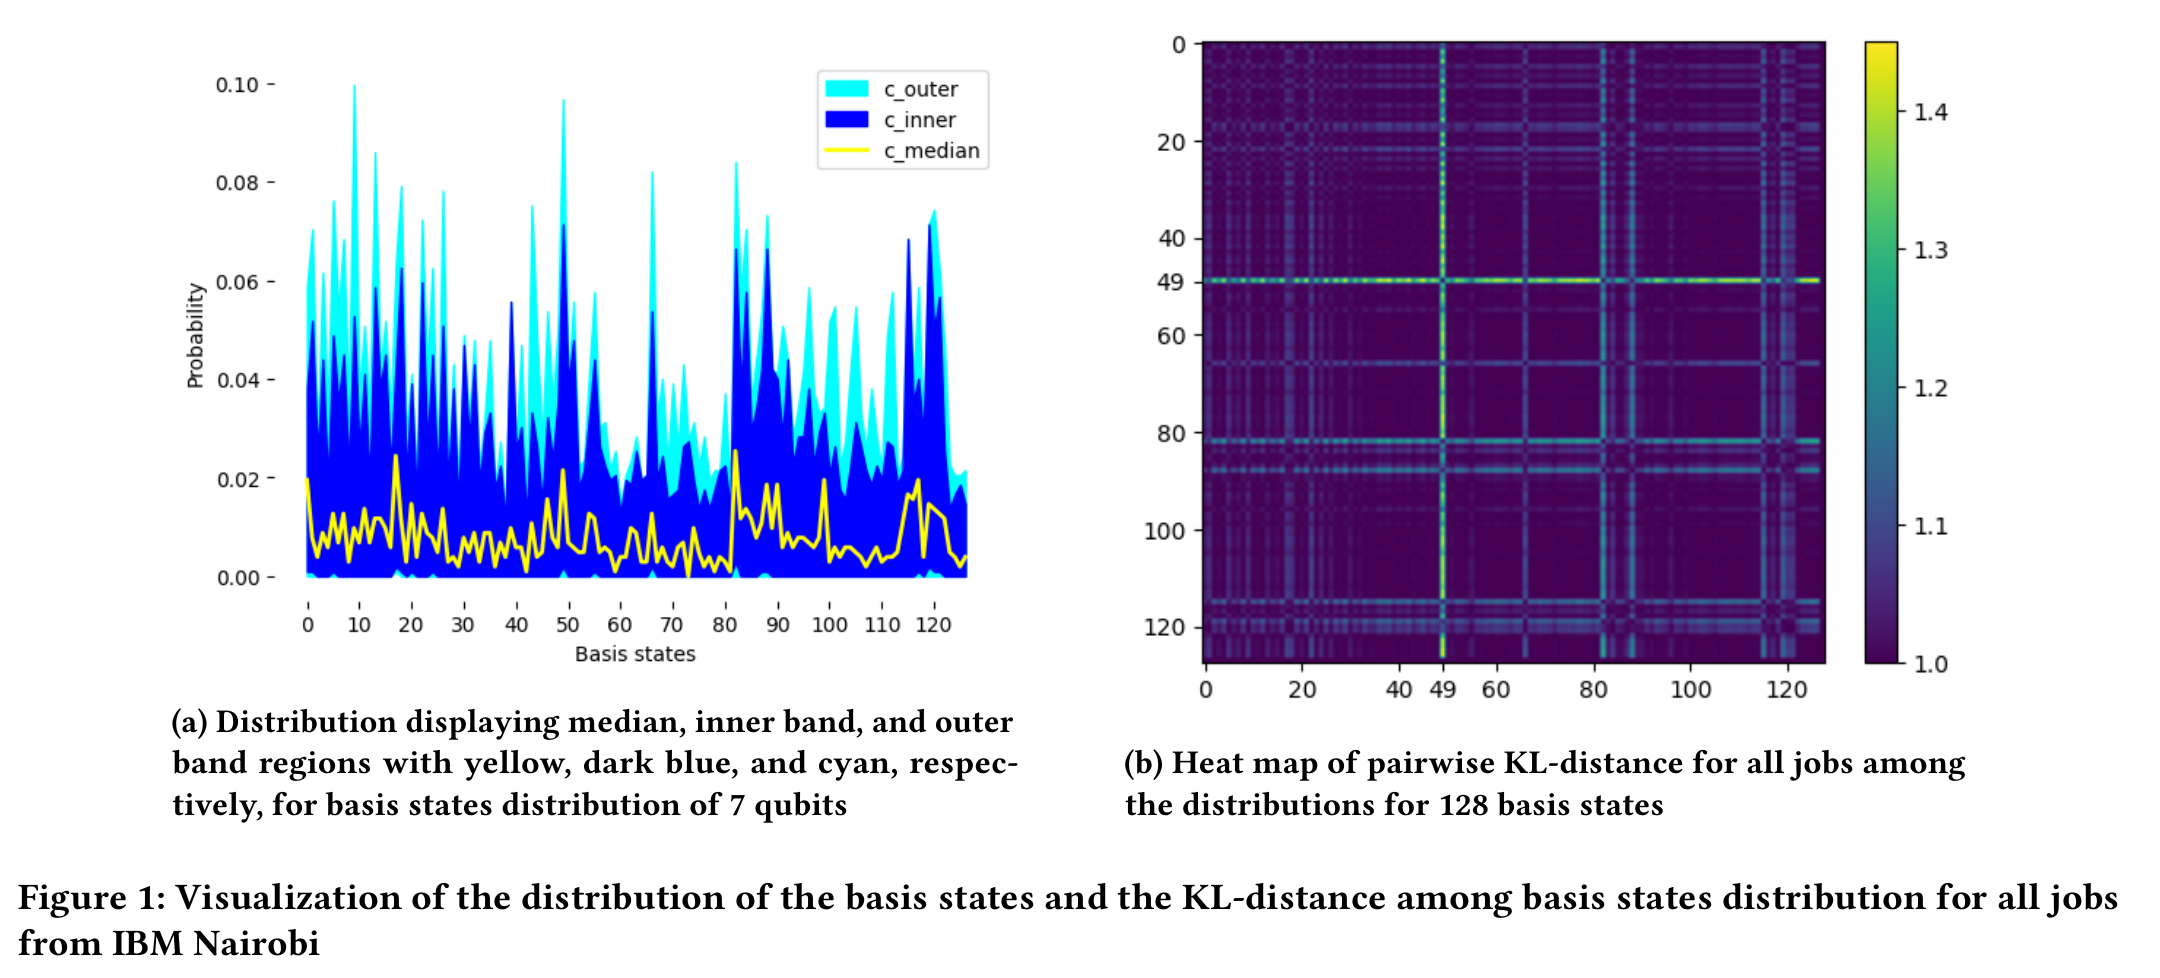
Complete nine-panel figure with functional box plot, KL-distance heatmap, projected basis states, cluster selection, and violin distributions.
RESEARCH2025

Visualization of Noisy and Less Noisy Computational Basis States in Quantum Computing

Priyabrata Senapati, Qiang Guan, David Pugmire, Cheng Chang Lu, Tushar M. Athawale

Combines distribution comparisons, dimensionality reduction, clustering, and violin plots to inspect variability in basis-state probabilities across quantum machine learning executions.

Usage & Purpose

Productivity & Utility

QC Subjects

Qubits & States
Visualization labels

Visual representations

Combined representations

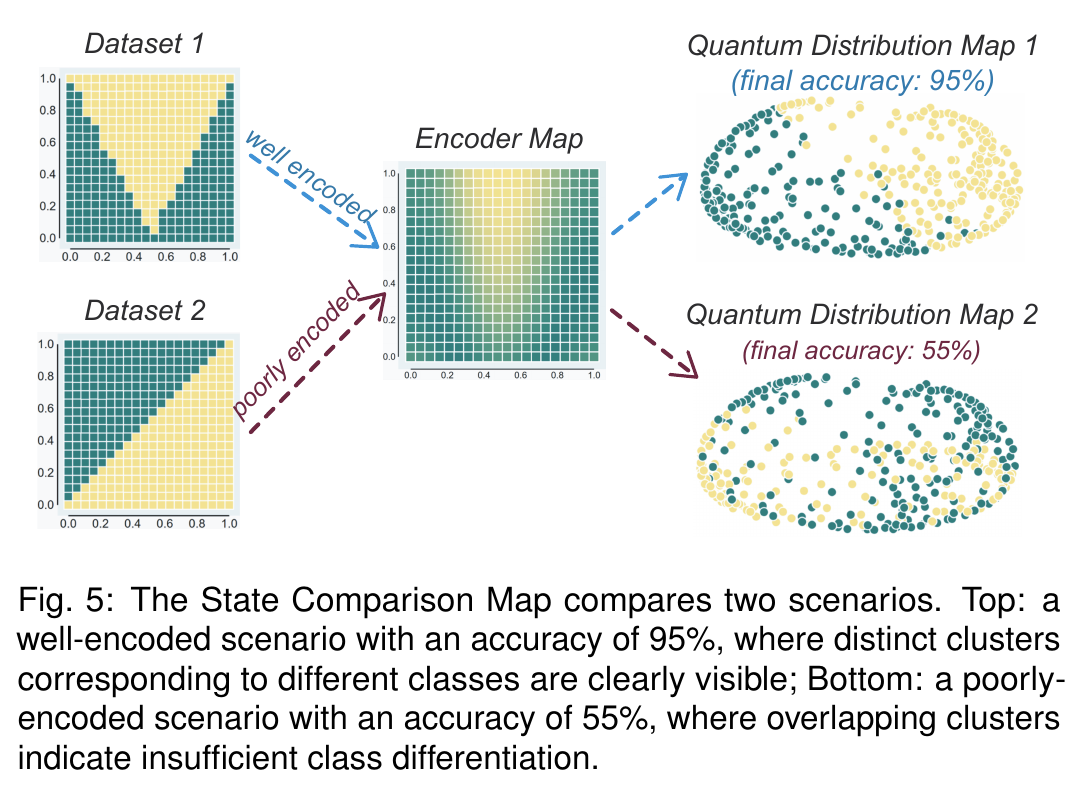
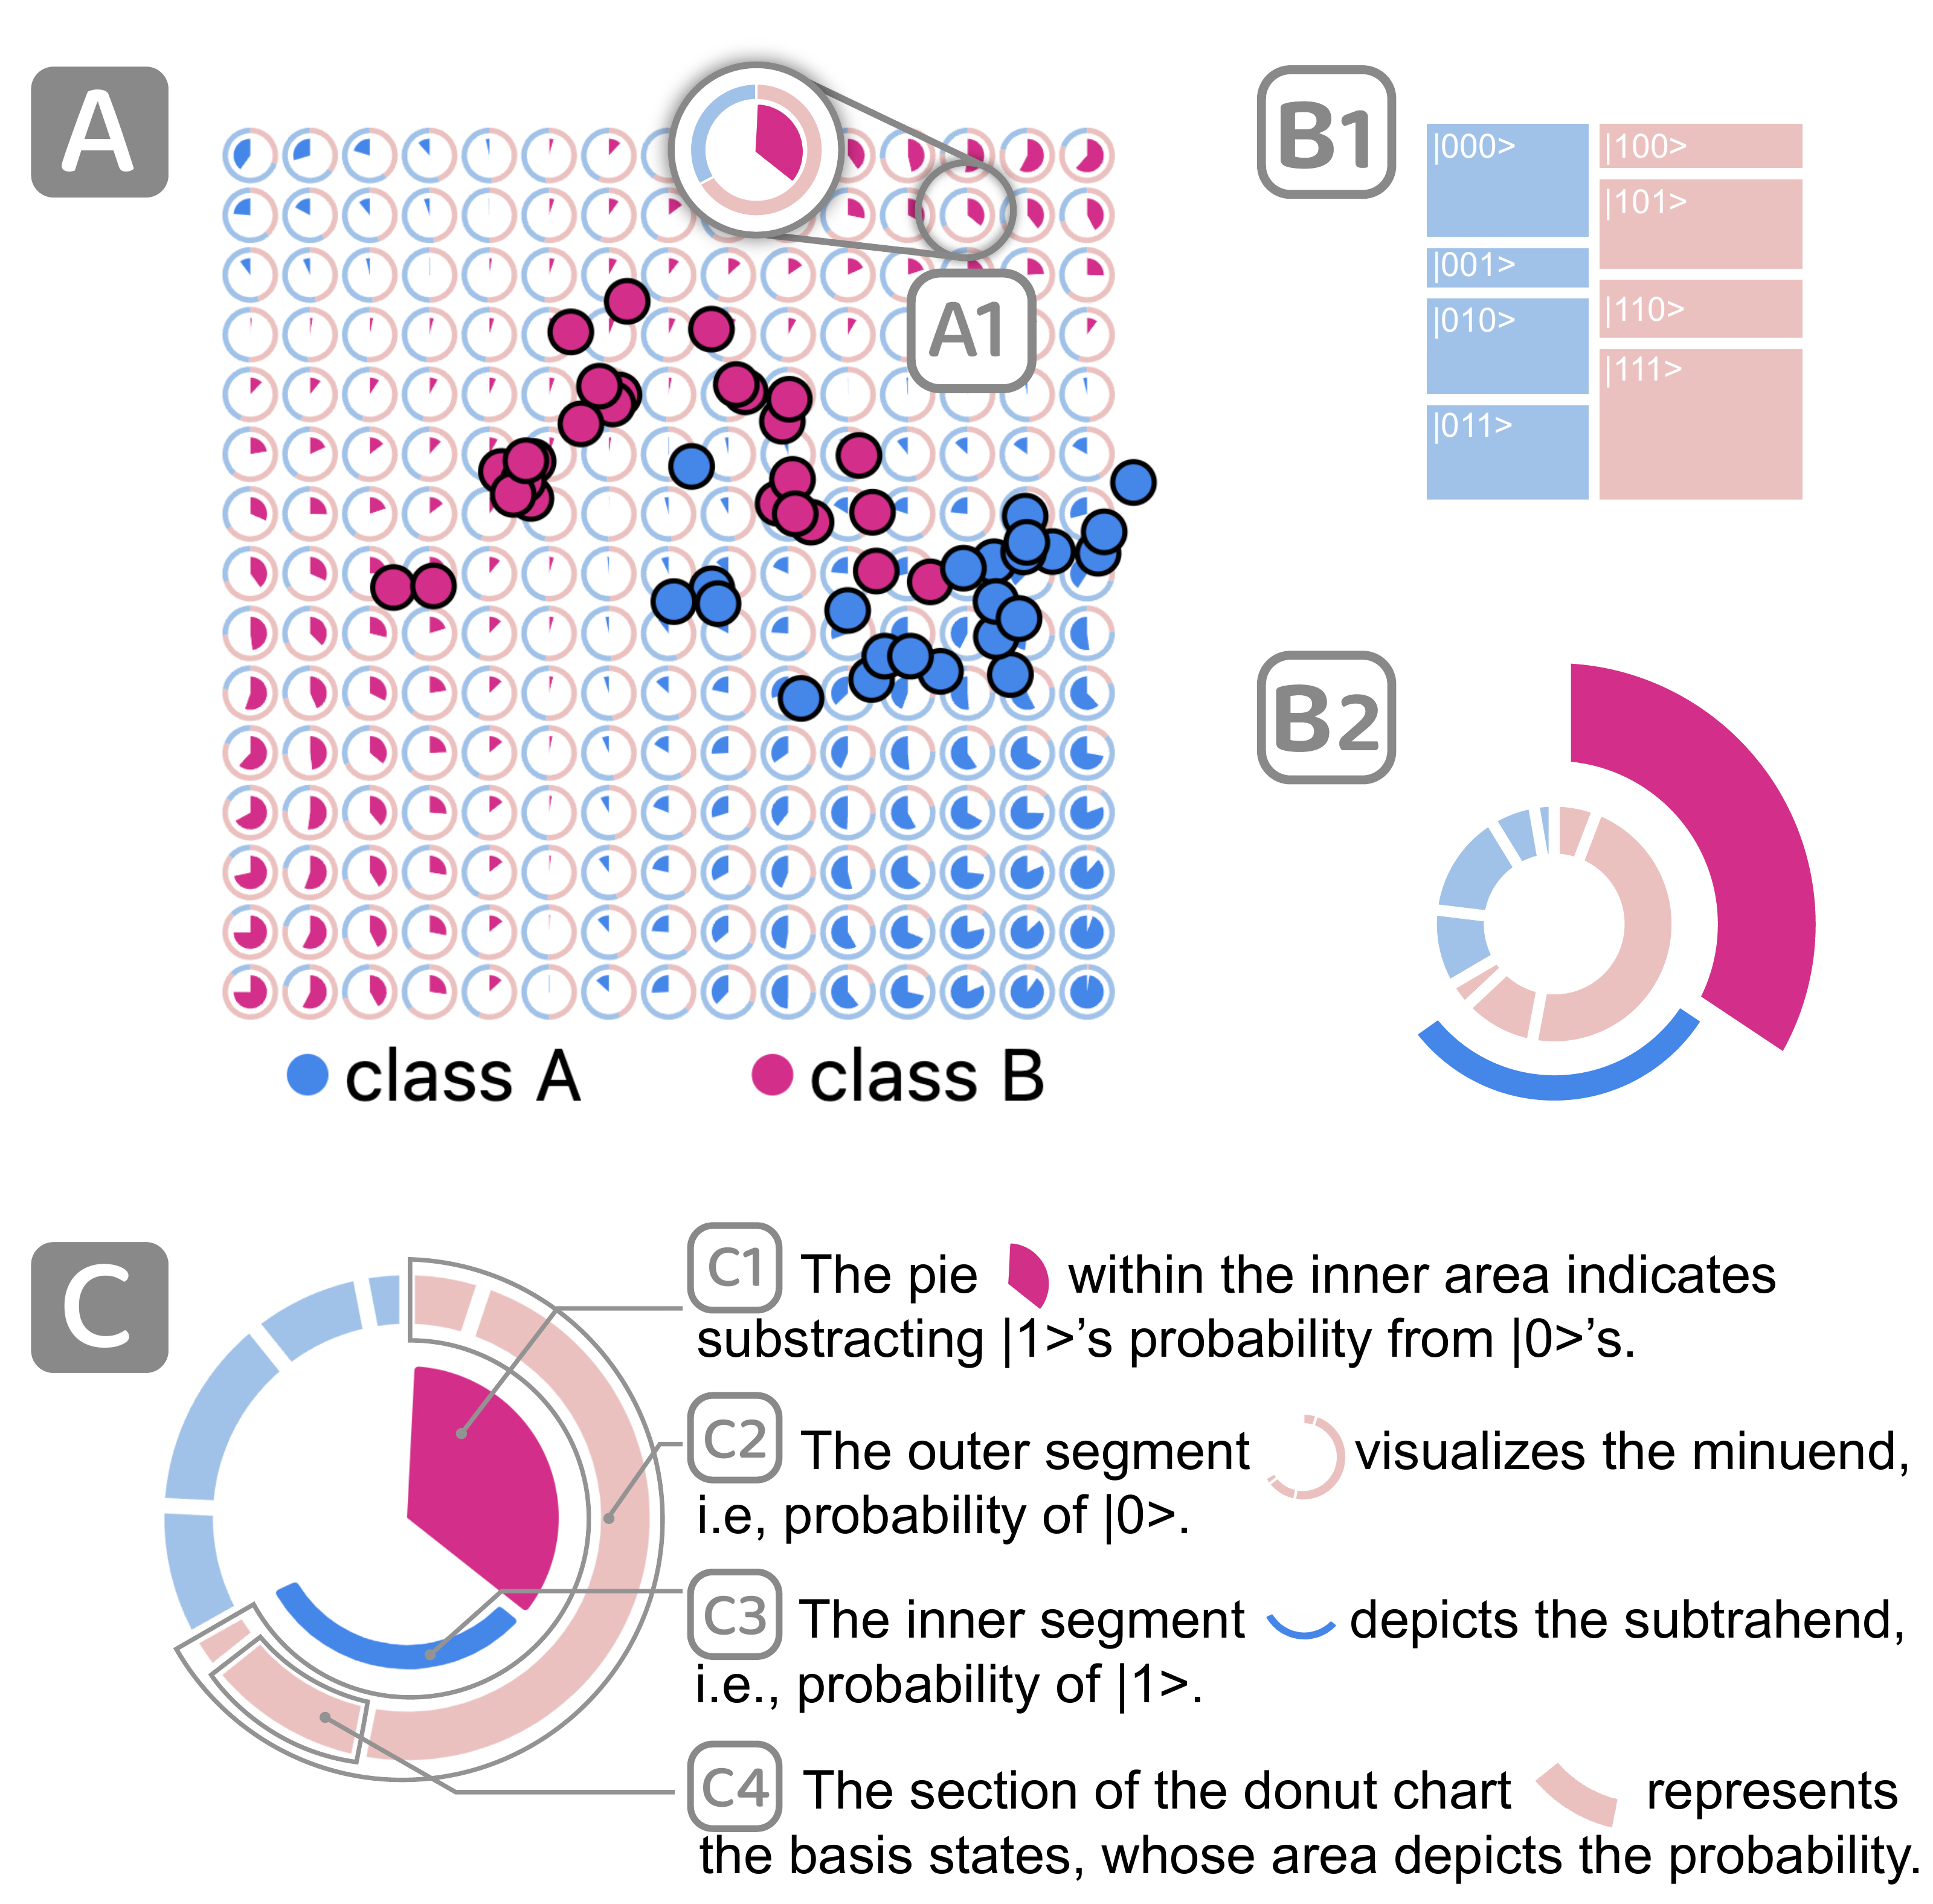
Two colored input datasets share an encoder map and lead to separated or overlapping class distributions, with source annotations of 95 and 55 percent accuracy.
RESEARCH2025

XQAI-Eyes

Shaolun Ruan, Feng Liang, Rohan Ramakrishna, Chao Ren, Rudai Yan, Qiang Guan, Jiannan Li, Yong Wang

Compares original data patterns with encoded quantum states through expectation maps, projected state distributions, and training plots to support encoder selection.

Usage & Purpose

Learning & InterpretationProductivity & Utility

QC Subjects

Qubits & StatesGates & Circuits
Visualization labels
TOOL2024

Bloqade

QuEra Computing

Bloqade is QuEra's open-source software for developing neutral-atom quantum programs. Its analog Python tools include a visual results report that combines measured bitstring counts with views of the corresponding atom states and spatial Rydberg densities. Selecting a measurement outcome connects its count to the configuration across the atom array, helping users inspect simulated or hardware results. The documented digital workflow also displays conventional circuit diagrams when comparing sequential and parallel programs. Those diagrams are rendered through Cirq after conversion from Bloqade programs. Together, these capabilities support routine inspection of measurement results and circuit structure during program development.

Usage & Purpose

Productivity & Utility

QC Subjects

Qubits & StatesGates & Circuits
Visualization labels

Visual representations

Combined representations

RESEARCH2024

Bridging the Quantum Education Gap: Hands-on Visualization Projects for Quantum Search Algorithm

Yao-Hsin Chou, Yu-Chi Jiang, Shu-Yu Kuo, Sun-Yuan Kung

Connects signed-amplitude bars, circuit calculations, and geometric rotations so learners can step through Grover search and compare iteration choices.

Usage & Purpose

Learning & Interpretation

QC Subjects

Qubits & StatesGates & CircuitsAlgorithm Development
Visualization labels

Visual representations

Combined representations

RESEARCH2024

HammingVis

Jieyi Chen, Zhen Wen, Li Zheng, Jiaying Lu, Hui Lu, Yiwen Ren, Wei Chen

Organizes measured bitstrings by their Hamming-distance relationships, linking probability charts, contribution matrices, and graphs to investigate noisy output distributions.

Usage & Purpose

Learning & InterpretationProductivity & Utility

QC Subjects

Qubits & States
Visualization labels
TOOL2024

Qadence

Pasqal

Qadence is a Python framework for building differentiable digital-analog quantum programs through composable blocks. Its drawing package displays blocks, circuits, and quantum models as conventional wire-and-gate diagrams, including named groups and Hamiltonian-evolution blocks. Developers can inspect how operations are sequenced or combined, print block composition as an ASCII tree, and export diagrams as SVG or PNG files. The examples cover individual gates, parameterized circuits, feature maps, and variational ansätze. These views help developers inspect program structure and prepare circuit illustrations. The official repository currently states that Qadence is not actively maintained.

Usage & Purpose

Productivity & Utility

QC Subjects

Gates & Circuits
Visualization labels

Visual representations

TOOL2024

Qiskit

IBM Quantum

Qiskit's Python SDK supplies complementary views of quantum states, circuits, and processors. State plots include measurement histograms, Bloch spheres, density-matrix city and Hinton plots, Pauli expectation bars, and the Q-sphere representation of basis-state probabilities and phases. Circuit drawers produce text, Matplotlib, or LaTeX diagrams, while dependency graphs and scheduling timelines expose operation relationships and idle intervals. Device maps show connectivity, errors, and the placement of compiled circuits on physical qubits. These views support learning, debugging, and development. Individual-qubit Bloch spheres omit correlations between qubits, and the core scheduling drawer has limitations for dynamic circuits.
Usage & Purpose

Learning & InterpretationProductivity & Utility

QC Subjects

Qubits & StatesGates & CircuitsMachines & Systems
Visualization labels
TOOL2024

Qrisp

Eclipse Qrisp

Qrisp combines high-level quantum programming with visual inspection of algorithm states and compiled circuits. Its quantum-backtracking visualizer places complex state amplitudes on the nodes of a branching search tree: hue represents phase, while brightness varies with amplitude magnitude. This connects the simulated state to decoded search paths and branch structure. Measurement histograms display probabilities for decoded variable values, and optimization plots track QAOA cost during a run. Conventional circuit diagrams are available through Qiskit's drawing machinery, including LaTeX export. Together, these facilities help developers inspect quantum variables, investigate backtracking behavior, and examine the circuits generated from their programs.

Usage & Purpose

Productivity & Utility

QC Subjects

Qubits & StatesGates & CircuitsAlgorithm Development
Visualization labels
TOOL2024

Qualtran

Google Quantum AI

Qualtran represents quantum programs as composable operations called bloqs and provides several ways to inspect their structure and resource costs. Register-aware graphs show operation blocks, their input and output ports, and the connections between them. Musical-score diagrams place operations along qubit or register wires. Hierarchical call graphs reveal how larger operations decompose into subroutines and can carry T, Clifford, and rotation counts; flame graphs expose the distribution of T costs across that hierarchy. A specialized graph drawer can also annotate classical simulation values. These views support program construction, debugging, and logical resource analysis, with Graphviz and Matplotlib providing rendering backends.

Usage & Purpose

Productivity & Utility

QC Subjects

Gates & Circuits
Visualization labels
RESEARCH2024

Quantum Backtracking in Qrisp Applied to Sudoku Problems

Raphael Seidel, René Zander, Matic Petrič, Niklas Steinmann, David Q. Liu, Nikolay Tcholtchev, Manfred Hauswirth

Draws quantum backtracking trees with signed node amplitudes, showing how search states evolve through successive operations and stop expanding below rejected nodes.

Usage & Purpose

Learning & Interpretation

QC Subjects

Qubits & StatesAlgorithm Development
Visualization labels

Visual representations

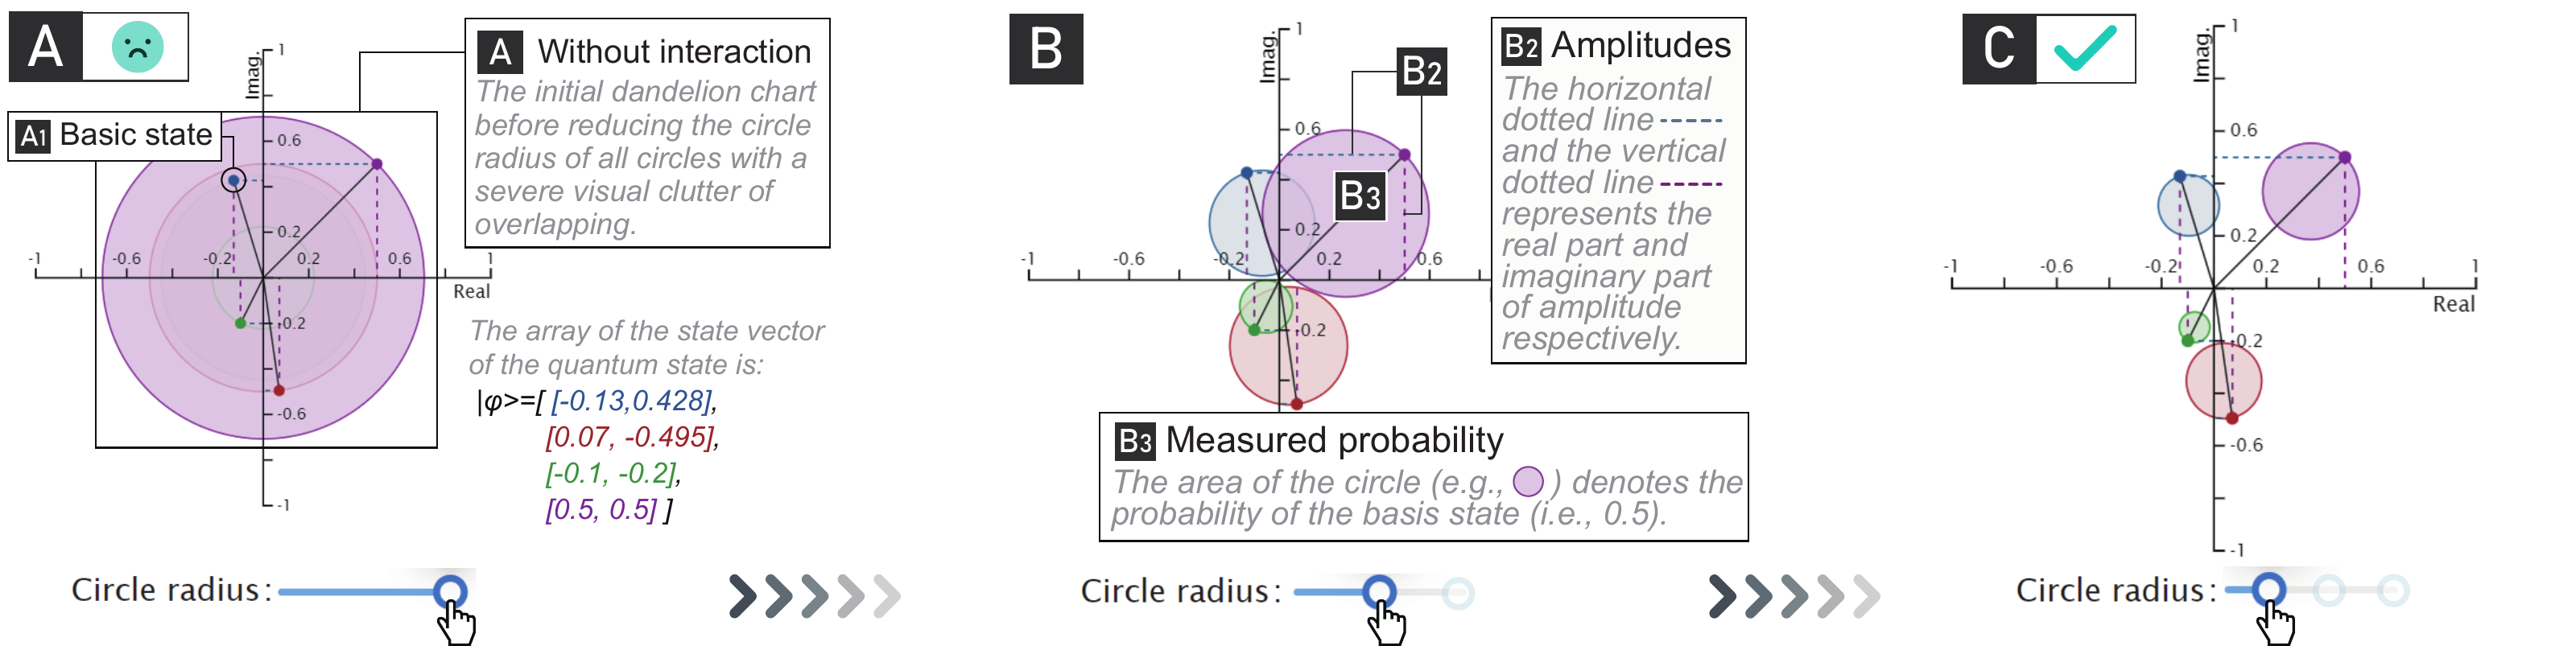
Three dandelion charts show the same amplitudes with progressively smaller probability circles, preserving axes, annotations, and slider settings.
RESEARCH2024

QuantumEyes

Shaolun Ruan, Qiang Guan, Paul Griffin, Ying Mao, Yong Wang

Combines state-evolution diagrams with amplitude and probability charts to trace how circuit gates change quantum states and contribute to measurement outcomes.

Usage & Purpose

Learning & Interpretation

QC Subjects

Qubits & StatesGates & Circuits
Visualization labels
RESEARCH · 2 PUBLICATIONS2023 / 2024

QVis

Chad A. Steed, Junghoon Chae, Samudra Dasgupta, Travis S. Humble

Links qubit performance histories, similarity groups, and hardware topology, while comparing transpiled circuits through circuit diagrams, depth, and gate counts.

Usage & Purpose

Productivity & Utility

QC Subjects

Qubits & StatesGates & CircuitsMachines & Systems
Visualization labels

Visual representations

Combined representations

RESEARCH2024

Visualizing entanglement in multiqubit systems

Jonas Bley, Eva Rexigel, Alda Arias, Nikolas Longen, Lars Krupp, Maximilian Kiefer-Emmanouilidis, Paul Lukowicz, Anna Donhauser, Stefan Küchemann, Jochen Kuhn, Artur Widera

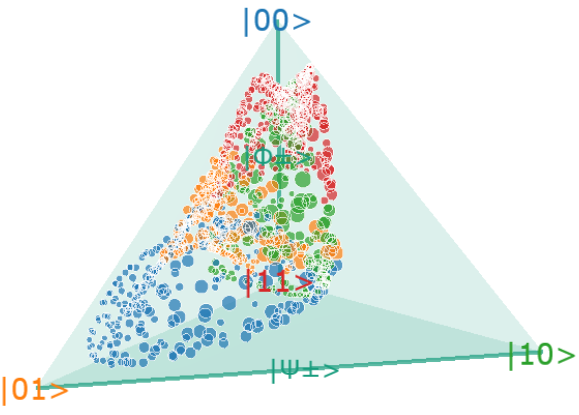
Arranges amplitude circles along qubit axes, using their sizes and phase directions to expose separability patterns and illustrate quantum operations.

Usage & Purpose

Learning & Interpretation

QC Subjects

Qubits & States
Visualization labels
TOOL2023

Cuda Q

NVIDIA

CUDA-Q is NVIDIA’s open-source platform for developing quantum applications in Python and C++, with execution across CPUs, GPUs, and quantum processors. Its core visualization tools support inspection of quantum programs and single-qubit states. The cudaq.draw interface represents a kernel’s execution path as a conventional circuit diagram, producing ASCII or LaTeX output. For state visualization, cudaq.add_to_bloch_sphere and cudaq.show use QuTiP to display Bloch spheres, including several state vectors on one sphere or multiple spheres in a grid. Developers can use these views to inspect gate sequences and compare single-qubit states. The Bloch-sphere interface accepts a single-qubit state vector or density matrix.

Usage & Purpose

Productivity & Utility

QC Subjects

Qubits & StatesGates & Circuits
Visualization labels
TOOL2023

Q#

Microsoft

Q# is Microsoft’s quantum programming language, accompanied by visualization tools in the Quantum Development Kit. In VS Code and Jupyter notebooks, developers can inspect qubit wires, gates, and measurements, view circuits for individual operations, and follow circuit changes while debugging. The graphical circuit editor links gate editing to a state panel showing basis-state probabilities and phases. For machine-level inspection, the QDK offers a neutral-atom device animation of qubit movement through storage, interaction, and measurement zones, plus resource-estimation plots comparing physical qubit requirements with runtime. These first-party tools support program development and analysis; the device animation represents execution without qubit loss or other noise.

Usage & Purpose

Productivity & Utility

QC Subjects

Qubits & StatesGates & CircuitsMachines & Systems
Visualization labels
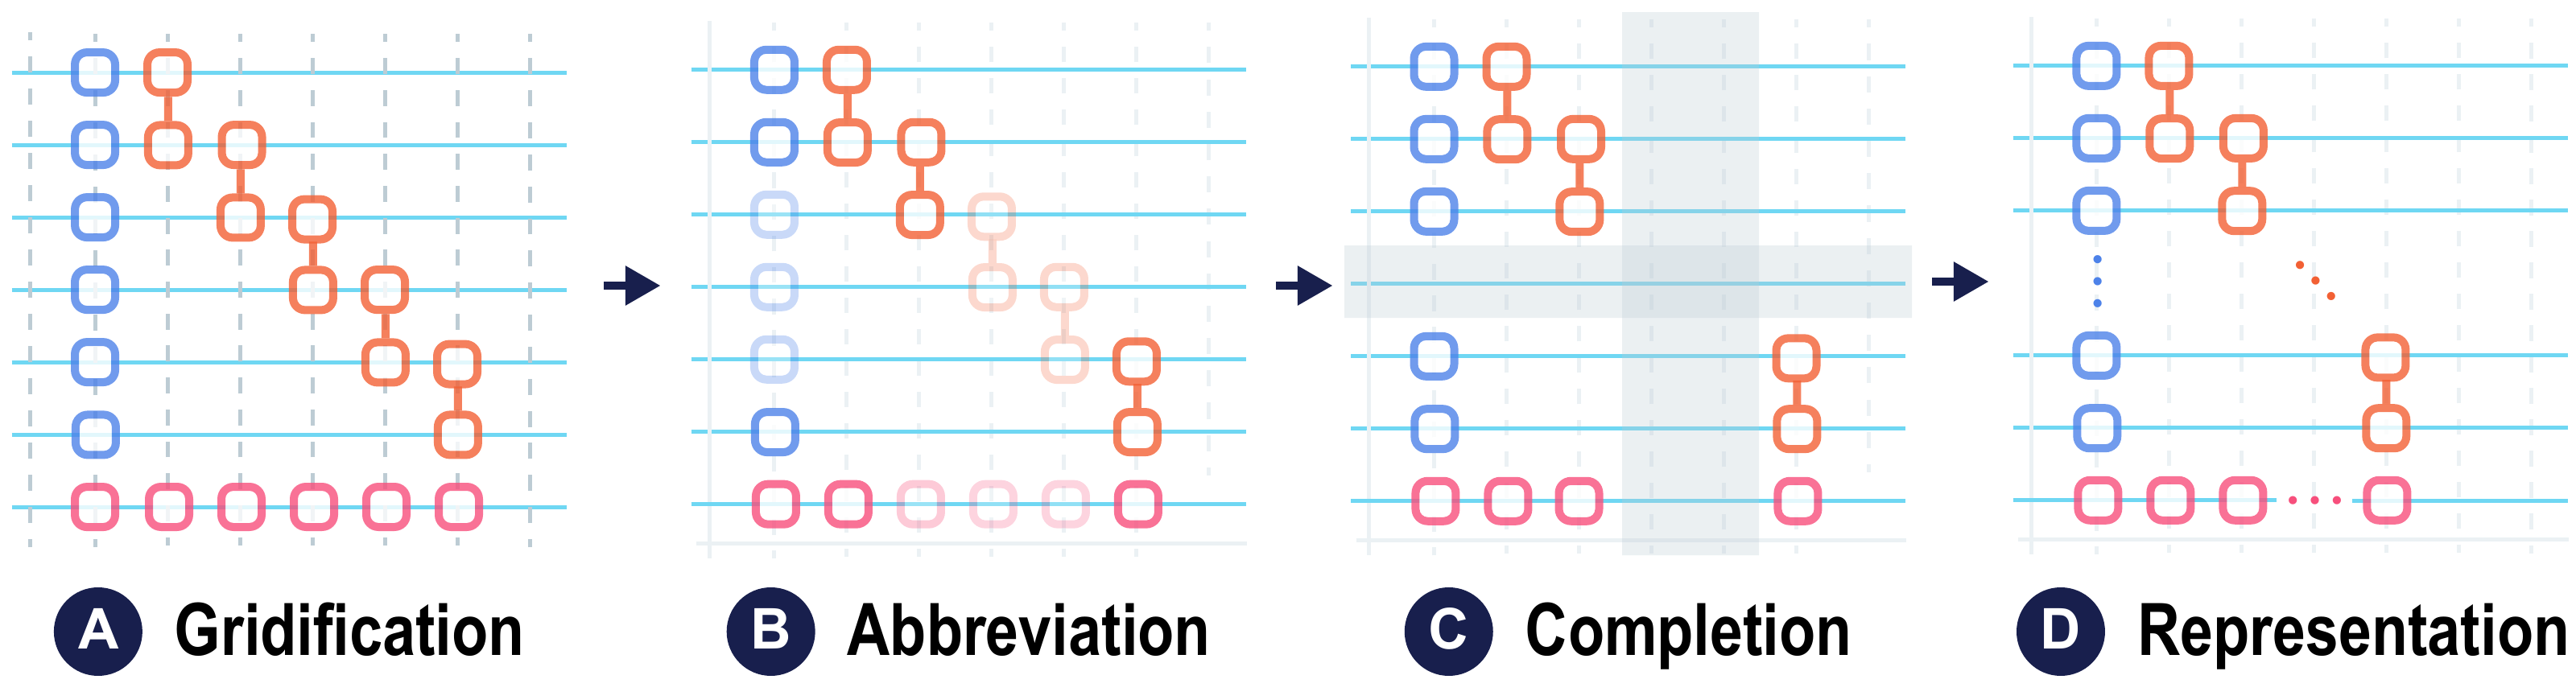
Four labeled circuit diagrams show gridification, abbreviation, completion, and the resulting compact representation.
RESEARCH2023

Quantivine

Zhen Wen, Yihan Liu, Siwei Tan, Jieyi Chen, Minfeng Zhu, Dongming Han, Jianwei Yin, Mingliang Xu, Wei Chen

Organizes large quantum circuits into expandable components and repeated patterns, linking circuit structure with qubit operation histories, parallelism, and connectivity.

Usage & Purpose

Productivity & Utility

QC Subjects

Gates & Circuits
Visualization labels
TOOL2023

Quantum Code Visualizer & PanQEC

PanQEC team

Quantum Code Visualizer and PanQEC support the inspection and evaluation of quantum error-correcting codes. PanQEC's browser interface displays two- and three-dimensional code lattices, using shapes and colors to distinguish qubits, stabilizers, Pauli errors, and violated checks. Users can insert errors, display logical operators, and apply a selected decoder's correction while examining the same code geometry. Custom codes can supply their own visual representations. The Python package also provides threshold and finite-size-scaling plots for comparing simulation results. These views support checking code implementations and studying error-correction behavior.

Usage & Purpose

Productivity & Utility

QC Subjects

Gates & CircuitsQEC
Visualization labels
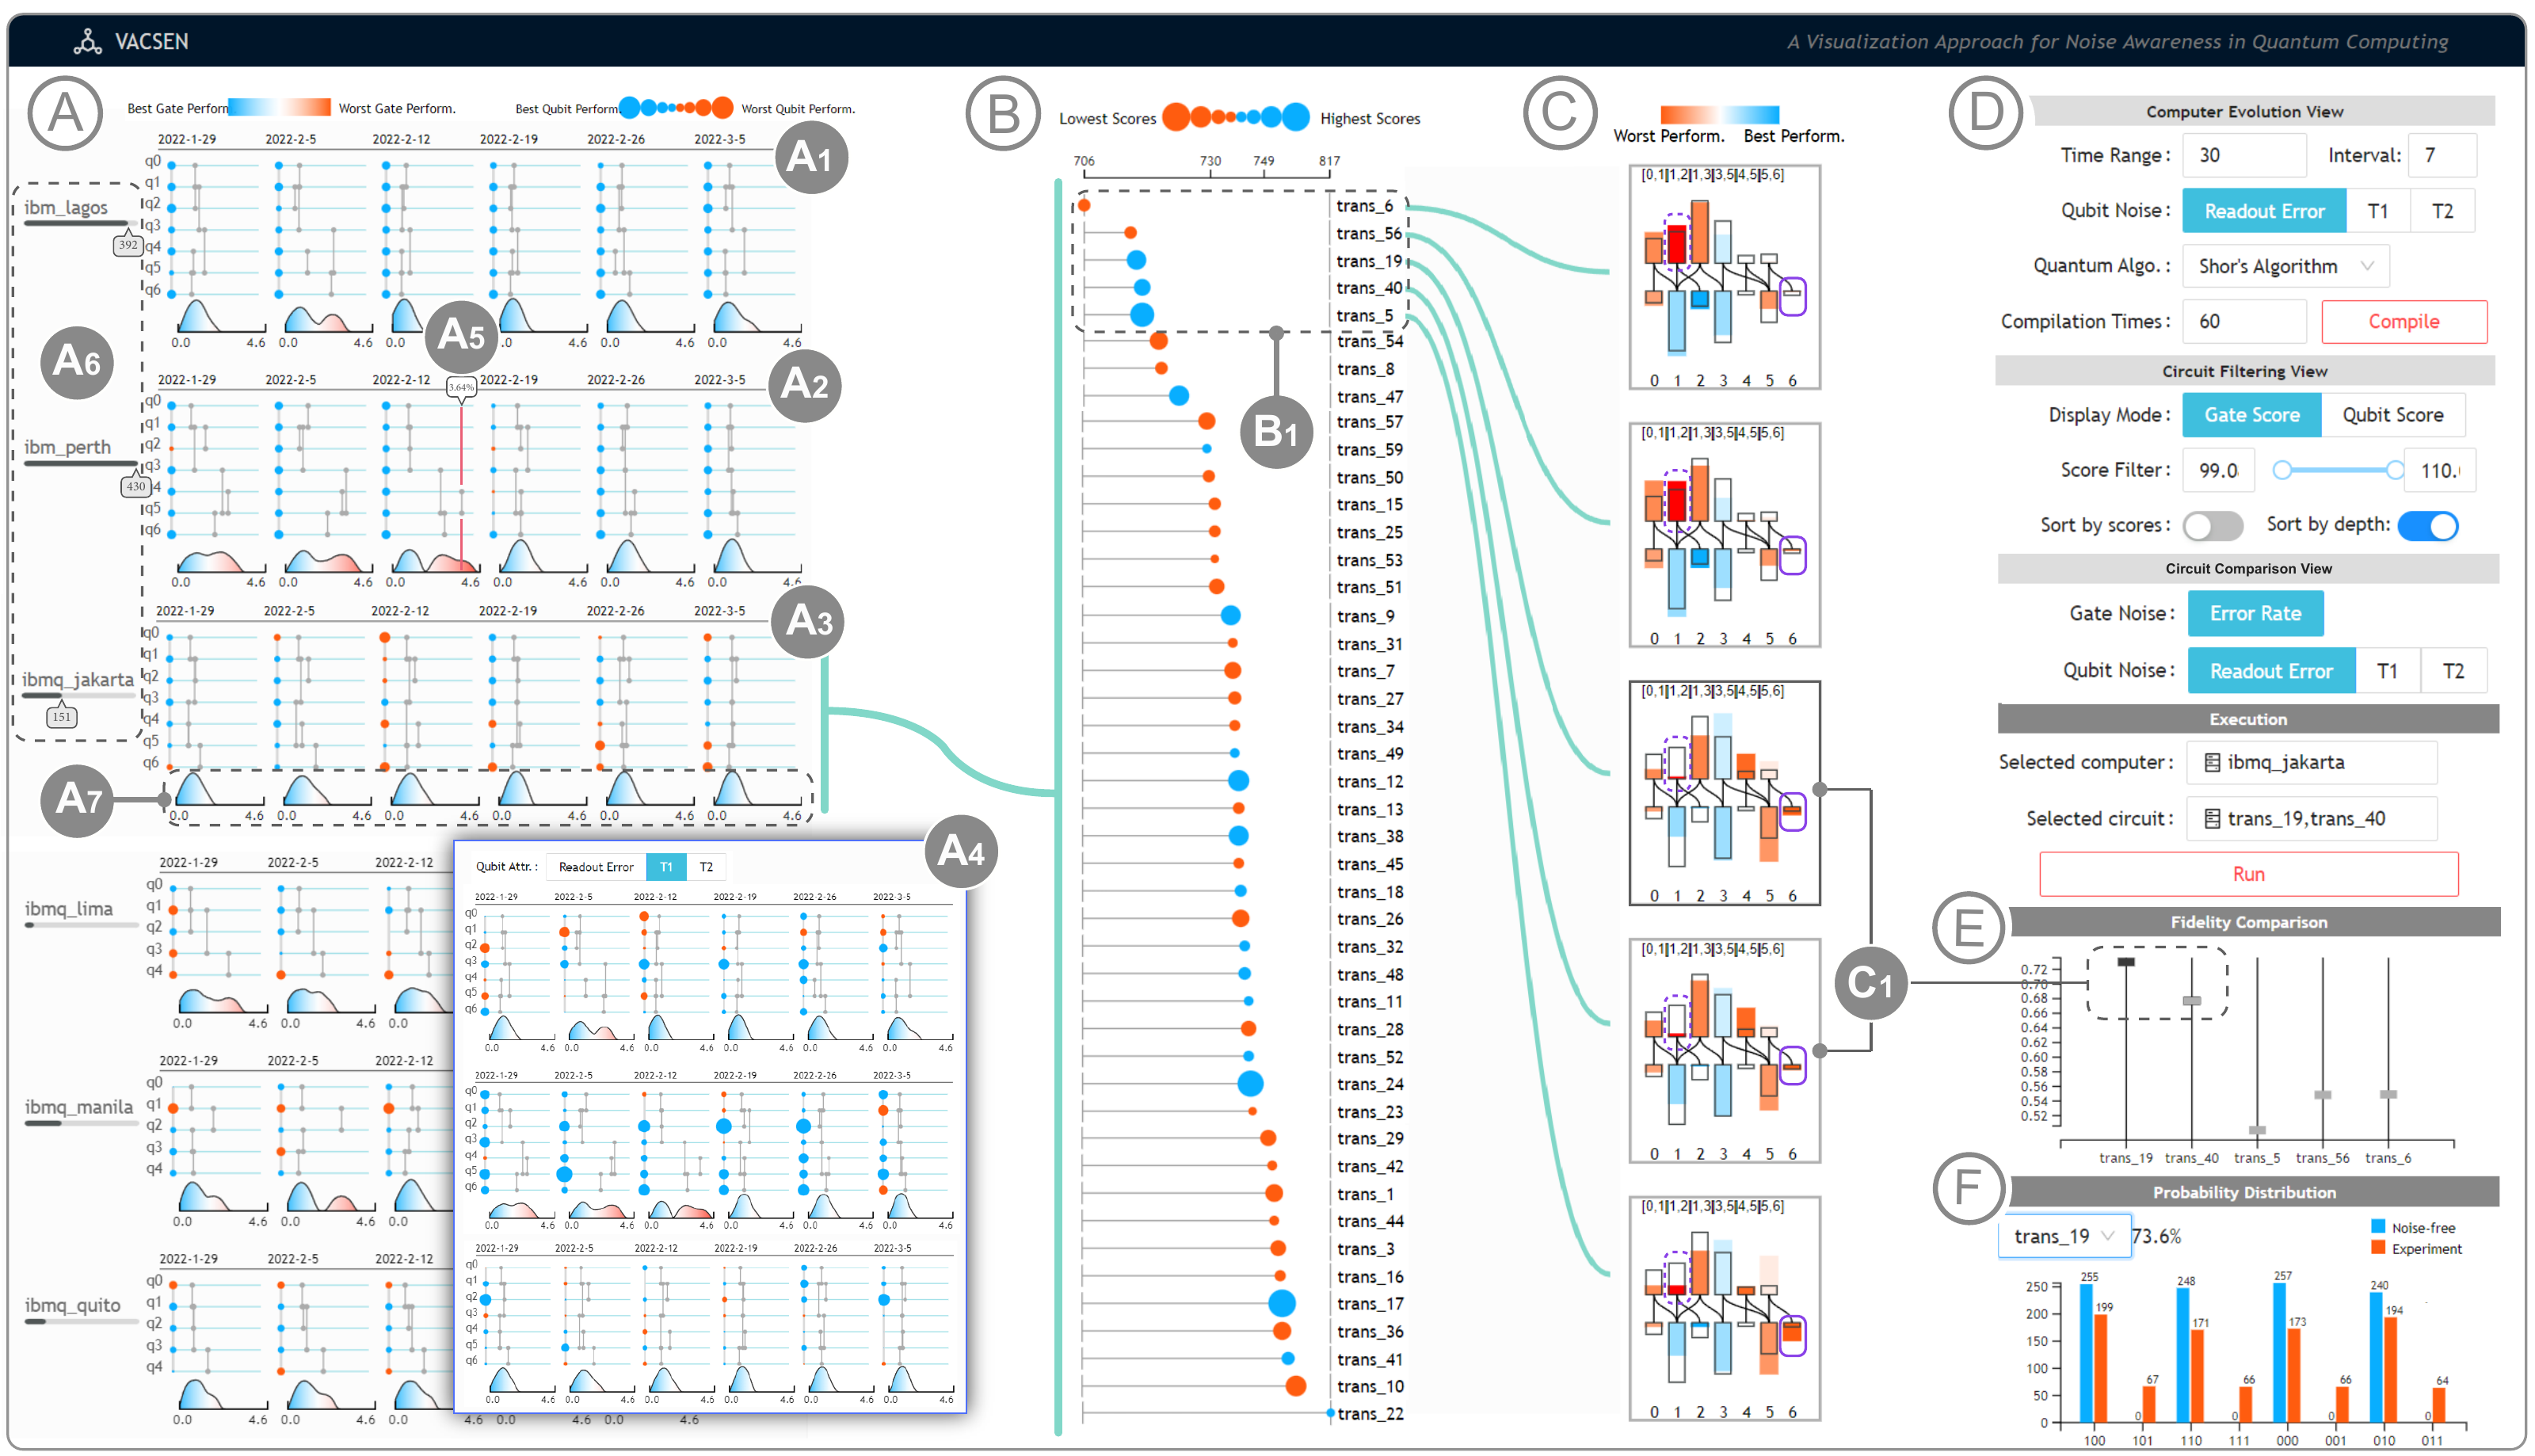
Complete VACSEN interface with temporal machine summaries, compiled-circuit lists, linked noise comparisons, controls, and result charts.
RESEARCH2023

VACSEN

Shaolun Ruan, Yong Wang, Weiwen Jiang, Ying Mao, Qiang Guan

Coordinates hardware noise histories, compiled-circuit filtering, and detailed comparisons to help users inspect device conditions and candidate circuit executions.

Usage & Purpose

Productivity & Utility

QC Subjects

Qubits & StatesGates & CircuitsMachines & Systems
Visualization labels
RESEARCH2022

Notational Programming for Notebook Environments: A Case Study with Quantum Circuits

Ian Arawjo, Anthony J. DeArmas, Michael Roberts, Shrutarshi Basu, Tapan Parikh

Connects handwritten quantum circuit diagrams with notebook code, using wire bundles and recursive subcircuits to express and execute circuit abstractions.

Usage & Purpose

Learning & InterpretationProductivity & Utility

QC Subjects

Gates & CircuitsMachines & Systems
Visualization labels

Visual representations

TOOL2022

PennyLane

Xanadu

PennyLane combines quantum programming with circuit inspection and analysis. Its text and Matplotlib drawers show operations, wires, measurements, and classical dependencies, while Fourier visualizations reveal the frequency content of parametrized circuit families. Available coefficient views include bar and violin plots, radial box plots, and panels in the complex plane, helping readers examine circuit expressivity. Through its Catalyst integration, PennyLane can also display compiled quantum operations as data-flow graphs with loops, conditionals, and compilation-pass changes for a single compiled QNode. These views support understanding circuit representations, inspecting program transformations, and exploring the behavior of parametrized circuit models.

Usage & Purpose

Learning & InterpretationProductivity & Utility

QC Subjects

Gates & Circuits
Visualization labels
TOOL2022

qBraid

qBraid Development Team

qBraid brings circuit and result visualization into a Python workflow that spans quantum programming frameworks and execution providers. Its visualization module draws conventional circuit diagrams and displays measurement counts or probabilities as bar charts, including comparisons between multiple runs. The circuit drawer delegates rendering to supported frameworks or PyQASM, so available output formats depend on the selected backend. Measurement plots associate computational-basis bitstrings with observed counts or probabilities, and plotting options distinguish several datasets within one figure. These views help developers inspect circuit structure and compare the output of quantum experiments.

Usage & Purpose

Productivity & Utility

QC Subjects

Qubits & StatesGates & Circuits
Visualization labels
RESEARCH2021

GraphStateVis

Matthias Miller, Daniel Miller

Links editable graph states with adjacency matrices, stabilizer summaries, and noise thresholds to explore their structure and entanglement properties.

Usage & Purpose

Learning & Interpretation

QC Subjects

Qubits & States
Visualization labels
TOOL2021

Qibo

Qibo team

Qibo is an open-source quantum-computing framework with built-in visual aids for inspecting small quantum programs and their simulated states. Its circuit tools produce Unicode diagrams or Matplotlib figures showing qubit wires, gates, controls, and measurements. Graphical drawing supports preset styles, gate clustering, and layout adjustments. For state inspection, plot_density_hist displays the real and imaginary density-matrix entries as paired three-dimensional bar charts. Users can adjust labels, colors, transparency, and figure size for these plots. These conventional views support circuit inspection and analysis of simulated states within Python workflows.

Usage & Purpose

Productivity & Utility

QC Subjects

Qubits & StatesGates & Circuits
Visualization labels
TOOL2021

Stim

Craig Gidney

Stim is a stabilizer-circuit simulator with visualization tools aimed at quantum error correction. Its diagrams range from ordinary operation timelines to spatial circuit layers, detector slices, and matching graphs derived from detector error models. Detector-slice overlays show how circuit operations relate to the stabilizers associated with detectors, while matching graphs expose connections between detectors and possible error mechanisms. SVG and three-dimensional outputs support inspection of larger structures. The bundled Crumble editor provides interactive circuit editing and Pauli-flow tracing. These views support the design and debugging of error-correction circuits, with each diagram exposing a different part of the circuit or error model.

Usage & Purpose

Productivity & Utility

QC Subjects

Gates & CircuitsQEC
Visualization labels

Visual representations

Combined representations

TOOL2020

Braket

Amazon Web Services

Amazon Braket combines a cloud quantum-computing service with a Python SDK for building and running quantum programs. The SDK renders circuits as text diagrams that show qubit wires and operations, supporting inspection during program construction. Official notebooks also demonstrate how to turn measurement counts into bar charts using Matplotlib. This separates the circuit drawer supplied by the SDK from plotting code supplied in examples. The linked resources offer a small starting workflow: construct a circuit, inspect its diagram, run a simulator, and visualize the resulting measurement distribution.

Usage & Purpose

Productivity & Utility

QC Subjects

Qubits & StatesGates & Circuits
Visualization labels

Visual representations

TOOL2020

qecsim

qecsim developers

qecsim is a Python package for simulating quantum error correction with stabilizer codes. Its lattice renderers show Pauli operators and syndrome checks in the spatial structure of planar, toric, rotated, and color codes. Developers can inspect an error, a proposed recovery, and their combined action to understand a decoding result. Official demonstrations add colored notebook output and use Matplotlib to compare logical failure rates across simulation settings. The visual focus is error-correction structure and behavior, with lightweight text drawings for individual runs and example plotting code for aggregate statistics.

Usage & Purpose

Productivity & Utility

QC Subjects

Gates & CircuitsQEC
Visualization labels

Visual representations

TOOL2020

TKet

Quantinuum

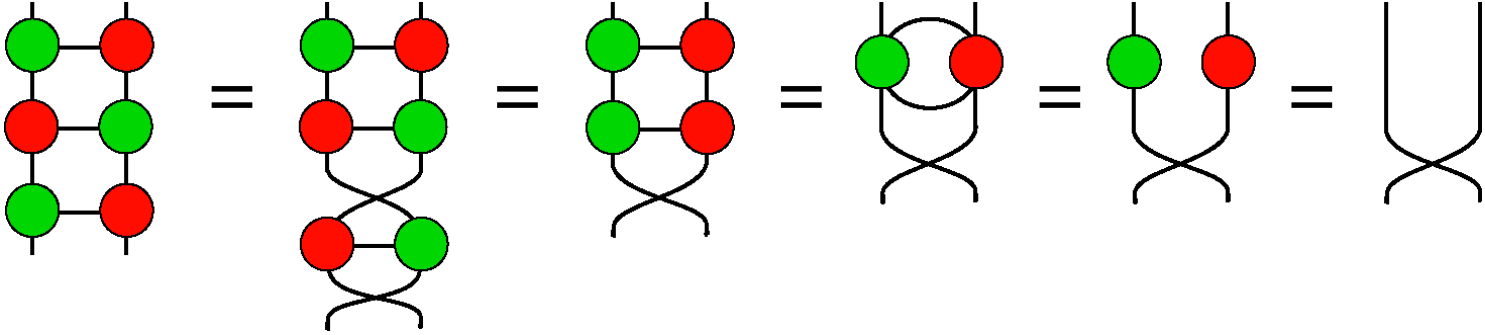
TKET is a quantum compilation toolkit with a Python interface, pytket. Its visualization facilities range from interactive wire-and-gate circuits to directed dependency graphs and graphs of qubit interactions. The circuit renderer supports notebook and browser display, comparison of multiple circuits, and inspection of nested circuit structure. Graphviz-based views expose dependencies that can be harder to follow in a long gate sequence. The ZX module provides another representation for composing and transforming quantum processes, with diagrams showing successive rewrite steps. These resources support inspection of program structure and the transformations used in quantum compilation.

Usage & Purpose

Productivity & Utility

QC Subjects

Gates & CircuitsAlgorithm Development
Visualization labels

Visual representations

TOOL2018

Cirq

Cirq developers

Cirq is a Python framework for constructing, transforming, and executing quantum circuits. Its circuit diagrams expose gates, qubit wires, parallel moments, and nested circuit operations, while state histograms summarize measured outcomes. Hardware-oriented views include heatmaps that place single-qubit and two-qubit metrics in a device's spatial layout. The cirq-google package also provides calibration plots and comparison histograms for processor metrics. These visualizations support circuit inspection, result analysis, and examination of hardware characteristics. The linked guides show the relevant APIs and distinguish locally supplied example data from workflows requiring access to Google's quantum service.

Usage & Purpose

Productivity & Utility

QC Subjects

Qubits & StatesGates & CircuitsMachines & Systems
Visualization labels
TOOL2016

pyQuil

Rigetti Computing

pyQuil is Rigetti's Python library for constructing Quil programs and working with quantum processors and simulators. Its visualization support includes conventional circuit diagrams and probability bar charts. The LaTeX module translates a program into a wire-and-gate diagram and can display the rendered result in a notebook when the required external tools are installed. Wavefunction.plot displays computational-basis outcome probabilities by bitstring. Together, these features let developers compare the structure of a program with its simulated output. The resources below focus on pyQuil's own interfaces for these tasks.

Usage & Purpose

Productivity & Utility

QC Subjects

Qubits & StatesGates & Circuits
Visualization labels
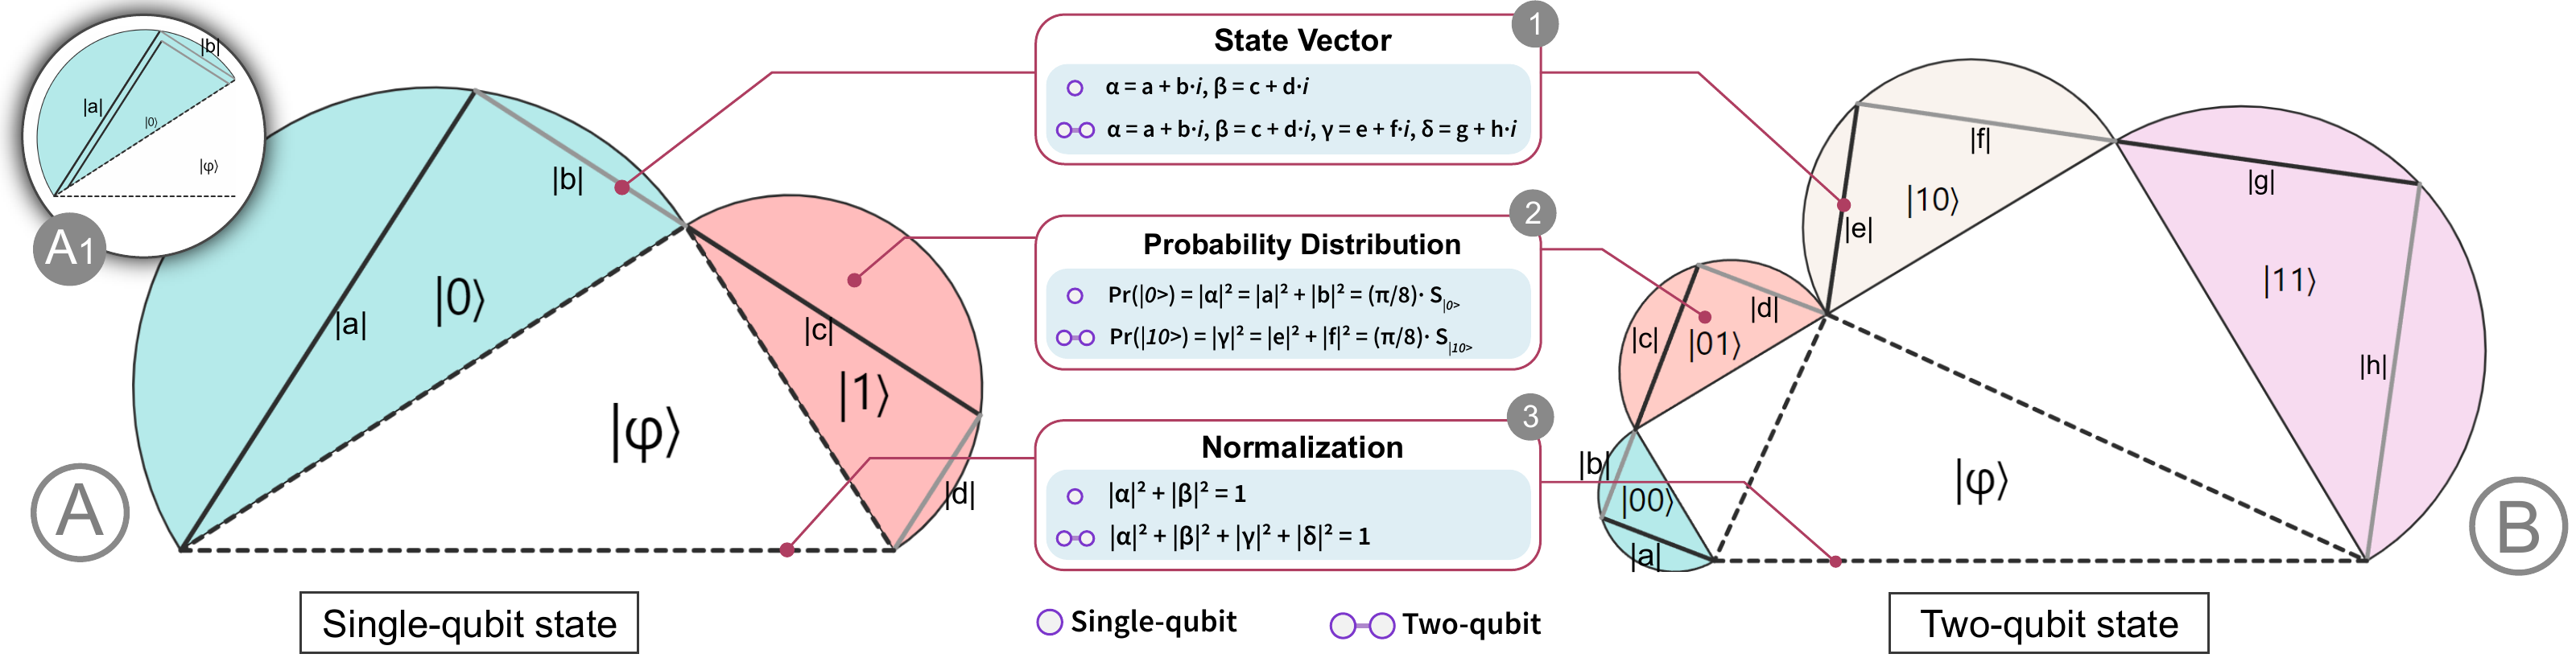
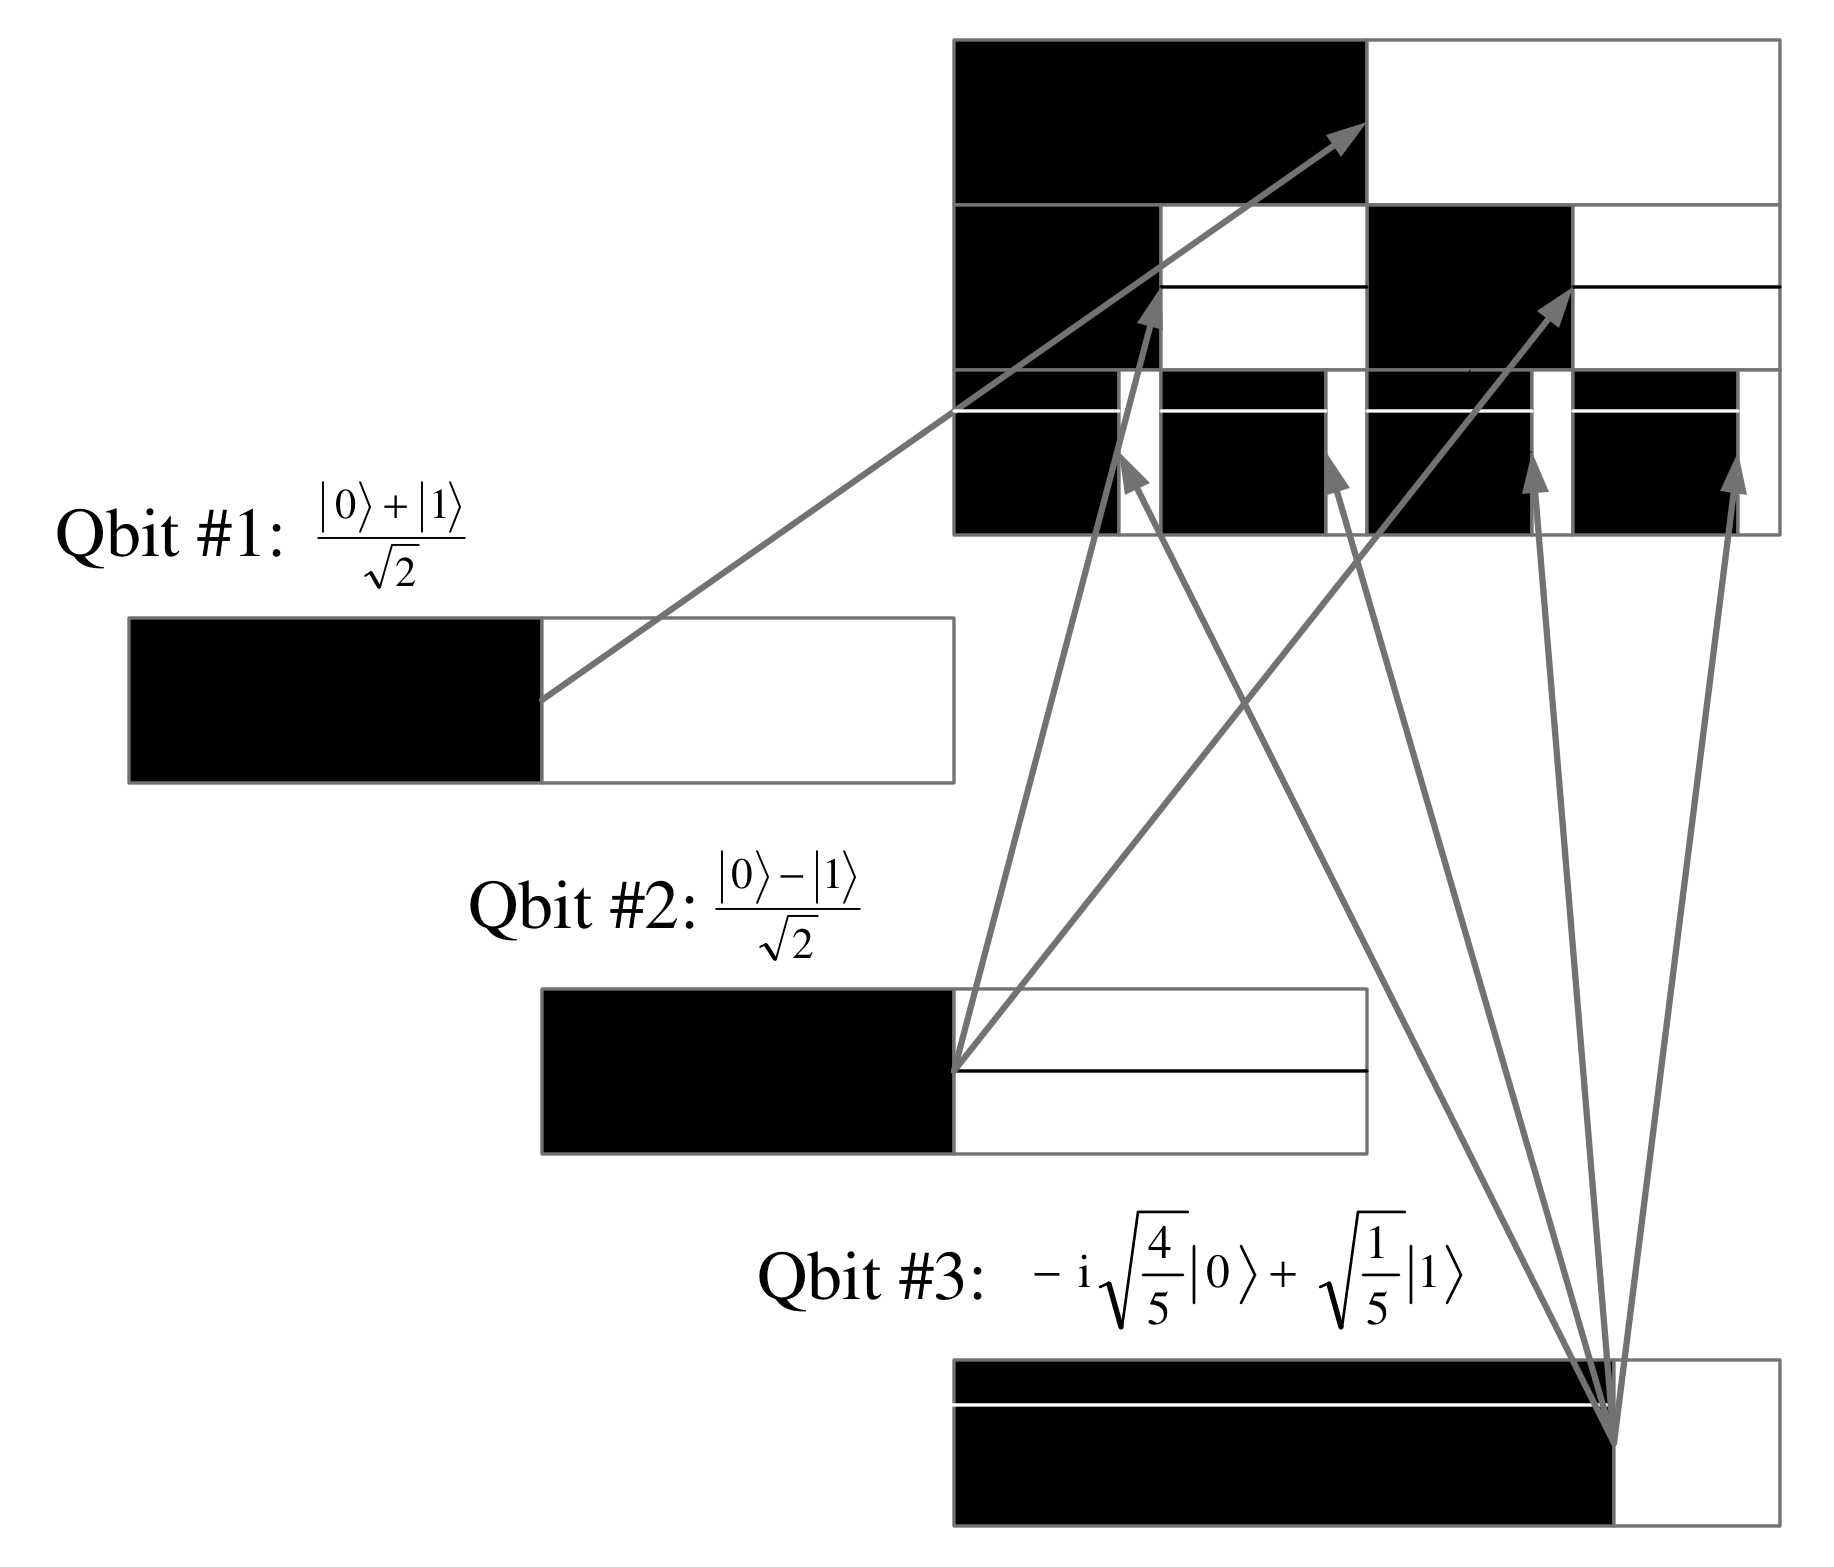
Three labeled single-qubit bars connect by arrows to successive rows of a recursively divided black-and-white state representation.
RESEARCH · 2 PUBLICATIONS2011 / 2012

Fractal Representation

Mate Galambos, Sandor Imre

Builds recursive bar patterns that encode multiqubit probabilities and phases, then shows how measurements and gates transform their structure.

Usage & Purpose

Learning & Interpretation

QC Subjects

Qubits & States
Visualization labels
TOOL · 3 PUBLICATIONS2012

QuTiP

QuTiP developers and contributors

QuTiP is a Python toolbox for simulating quantum systems and inspecting their states and dynamics. Its core visualization functions include Bloch spheres, probability distributions, density-matrix plots, and phase-space views. Qubism and Schmidt plots offer complementary ways to inspect many-particle amplitudes, partitions, and entanglement through spatial arrangements and color. Animation functions can display sequences of simulated states. These views are useful for exploring simulation results and building explanations of quantum behavior. Its documentation provides both introductory examples and detailed references for choosing and customizing a representation.

Usage & Purpose

Learning & InterpretationProductivity & Utility

QC Subjects

Qubits & States
Visualization labels

Filter the collection

Refine collection
01 Usage & Purpose

Why is it visualized?

02 QC Subjects

What is visualized?

03 Visualization

How is it visualized?

Selecting a branch includes its descendants. Choose a child to narrow it. A dash marks selected descendants.

  • 68 matching entries
    • 24 matching entries
    • 64 matching entries
  • 21 matching entries
    • 20 matching entries
    • 12 matching entries
37 matching entries

Data-type labels were assessed for 21 of 69 entries. Unassessed entries do not match those branches.

Entry type
Year

Both endpoints are included. The first bin includes 2015 and all earlier years. Use arrow keys to move one bin at a time.

Visual design

Applies to selected subjects. An entry can include both kinds of view.